
Learn about fundamentals, methodology, and tooling for endpoint security monitoring.
Task 1 Room Introduction
In this room, we will introduce the fundamentals of endpoint security monitoring, essential tools, and high-level methodology. This room gives an overview of determining a malicious activity from an endpoint and mapping its related events.
To start with, we will tackle the following topics to build a stepping stone on how to deal with Endpoint Security Monitoring.
- Endpoint Security Fundamentals
- Endpoint Logging and Monitoring
- Endpoint Log Analysis
At the end of this room, we will have a threat simulation wherein you need to investigate and remediate the infected machines. This activity may require you first to understand the fundamentals of endpoint security monitoring to complete it.
Now, let’s deep-dive into the basics of Endpoint Security!
Task 2 Endpoint Security Fundamentals
Core Windows Processes
Before we deal with learning how to deep-dive into endpoint logs, we need first to learn the fundamentals of how the Windows Operating System works. Without prior knowledge, differentiating an outlier from a haystack of events could be problematic.
To learn more about Core Windows Processes, a built-in Windows tool named Task Manager may aid us in understanding the underlying processes inside a Windows machine.
Task Manager is a built-in GUI-based Windows utility that allows users to see what is running on the Windows system. It also provides information on resource usage, such as how much each process utilizes CPU and memory. When a program is not responding, the Task Manager is used to terminate the process.
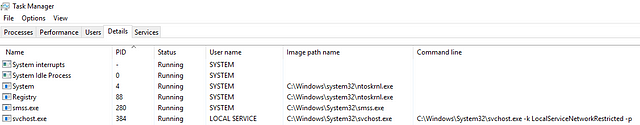
A Task Manager provides some of the Core Windows Processes running in the background. Below is a summary of running processes that are considered normal behaviour.
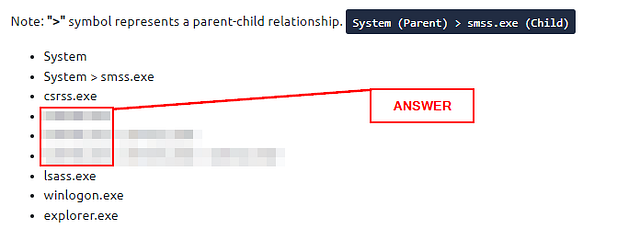
Note: “>” symbol represents a parent-child relationship. System (Parent) > smss.exe (Child)
- System
- System > smss.exe
- csrss.exe
- wininit.exe
- wininit.exe > services.exe
- wininit.exe > services.exe > svchost.exe
- lsass.exe
- winlogon.exe
- explorer.exe
In addition, the processes with no depiction of a parent-child relationship should not have a Parent Process under normal circumstances, except for the System process, which should only have System Idle Process (0) as its parent process.
You may refer to the Core Windows Processes Room to learn more about this topic.
Sysinternals
With the prior knowledge of Core Windows Processes, we can now proceed to discuss the available toolset for analyzing running artifacts in the backend of a Windows machine.
The Sysinternals tools are a compilation of over 70+ Windows-based tools. Each of the tools falls into one of the following categories:
- File and Disk Utilities
- Networking Utilities
- Process Utilities
- Security Utilities
- System Information
- Miscellaneous
We will introduce two of the most used Sysinternals tools for endpoint investigation for this task.
- TCPView — Networking Utility tool.
- Process Explorer — Process Utility tool.
TCPView
“TCPView is a Windows program that will show you detailed listings of all TCP and UDP endpoints on your system, including the local and remote addresses and state of TCP connections. On Windows Server 2008, Vista, and XP, TCPView also reports the name of the process that owns the endpoint. TCPView provides a more informative and conveniently presented subset of the Netstat program that ships with Windows. The TCPView download includes Tcpvcon, a command-line version with the same functionality.” (official definition)
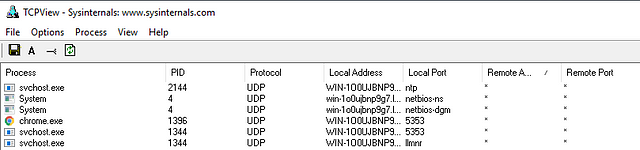
As shown above, every connection initiated by a process is listed by the tool, which may aid in correlating the network events executed concurrently.
Process Explorer
“The Process Explorer display consists of two sub-windows. The top window always shows a list of the currently active processes, including the names of their owning accounts, whereas the information displayed in the bottom window depends on the mode that Process Explorer is in: if it is in handle mode, you’ll see the handles that the process selected in the top window has opened; if Process Explorer is in DLL mode you’ll see the DLLs and memory-mapped files that the process has loaded.” (official definition)
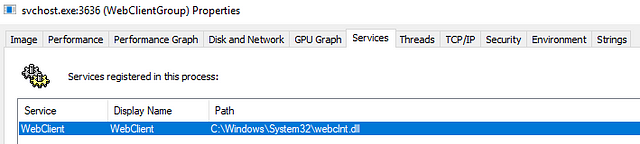
Process Explorer enables you to inspect the details of a running process, such as:
- Associated services
- Invoked network traffic
- Handles such as files or directories opened
- DLLs and memory-mapped files loaded
To learn more about Sysinternals, you may refer to the Sysinternals Room.
Answer the questions below
Since the answers can be found above, I won’t share the actual answer below. Just where you can find them.
What is the normal parent process of services.exe?
The answer can be found under the TaskManager section above. Look for Note:, under which you will see different process names. Look for services.exe, once you find it look at the process name to the left. This is the Parent Process and thus the answer to the question. Once you find it, type the answer into the TryHackMe answer field and click Submit.
What is the name of the network utility tool introduced in this task?
This answer first appears in the Sysinternals section. But then the section afterwards is all about this tool. Once you find it, type the answer into the TryHackMe answer field and click Submit.

Task 3 Endpoint Logging and Monitoring
From the previous task, we have learned basic knowledge about the Windows Operating system in terms of baseline processes and essential tools to analyze events and artefacts running on the machine. However, this only limits us from observing real-time events. With this, we will introduce the importance of endpoint logging, which enables us to audit significant events across different endpoints, collect and aggregate them for searching capabilities, and better automate the detection of anomalies.
Windows Event Logs
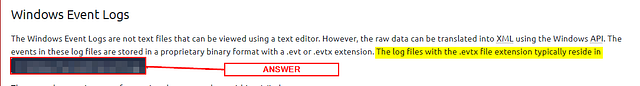
The Windows Event Logs are not text files that can be viewed using a text editor. However, the raw data can be translated into XML using the Windows API. The events in these log files are stored in a proprietary binary format with a .evt or .evtx extension. The log files with the .evtx file extension typically reside in C:\Windows\System32\winevt\Logs.
There are three main ways of accessing these event logs within a Windows system:
- Event Viewer (GUI-based application)
- Wevtutil.exe (command-line tool)
- Get-WinEvent (PowerShell cmdlet)
An example image of logs viewed using the Event Viewer tool is shown below.
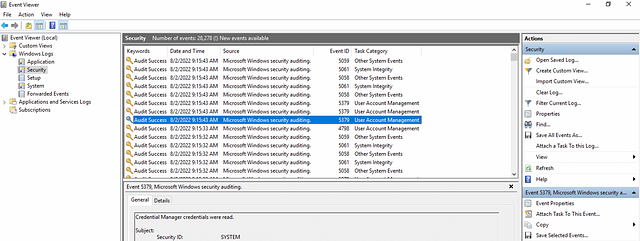
You may refer to the Windows Event Logs Room to learn more about Windows Event Logs.
Sysmon
Sysmon, a tool used to monitor and log events on Windows, is commonly used by enterprises as part of their monitoring and logging solutions. As part of the Windows Sysinternals package, Sysmon is similar to Windows Event Logs with further detail and granular control.
Sysmon gathers detailed and high-quality logs as well as event tracing that assists in identifying anomalies in your environment. It is commonly used with a security information and event management (SIEM) system or other log parsing solutions that aggregate, filter, and visualize events.
Lastly, Sysmon includes 27 types of Event IDs, all of which can be used within the required configuration file to specify how the events should be handled and analyzed. An excellent example of a configuration file auditing different Event IDs created by SwiftOnSecurity is linked here.
The image below shows a sample set of Sysmon logs viewed using an Event Viewer.
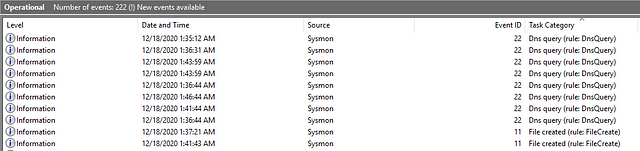
To learn more about Sysmon, you may refer to the Sysmon Room.
OSQuery
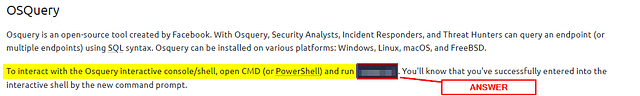
Osquery is an open-source tool created by Facebook. With Osquery, Security Analysts, Incident Responders, and Threat Hunters can query an endpoint (or multiple endpoints) using SQL syntax. Osquery can be installed on various platforms: Windows, Linux, macOS, and FreeBSD.
To interact with the Osquery interactive console/shell, open CMD (or PowerShell) and run osqueryi. You’ll know that you’ve successfully entered into the interactive shell by the new command prompt.
1
2
3
4
5
								cmd.exe

C:\Users\Administrator\> osqueryi
Using a virtual database. Need help, type 'help'
osquery>
A sample use case for using OSQuery is to list important process information by its process name.
1
2
3
4
5
6
7
8
9
								 osqueryi

osquery> select pid,name,path from processes where name='lsass.exe';
+-----+-----------+-------------------------------+
| pid | name      | path                          |
+-----+-----------+-------------------------------+
| 748 | lsass.exe | C:\Windows\System32\lsass.exe |
+-----+-----------+-------------------------------+
osquery>
Osquery only allows you to query events inside the machine. But with Kolide Fleet, you can query multiple endpoints from the Kolide Fleet UI instead of using Osquery locally to query an endpoint. A sample of Kolide Fleet in action below shows a result of a query listing the machines with the lsass process running.
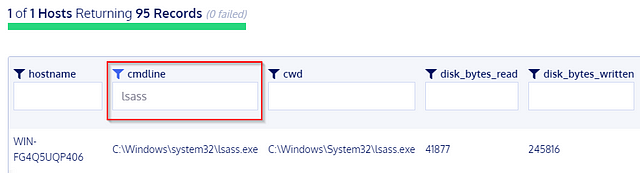
To learn more about OSQuery, you may refer to the OSQuery Room.
Wazuh
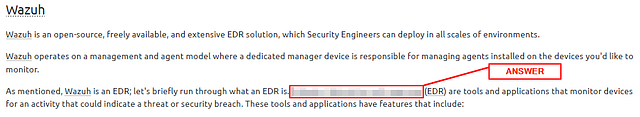
Wazuh is an open-source, freely available, and extensive EDR solution, which Security Engineers can deploy in all scales of environments.
Wazuh operates on a management and agent model where a dedicated manager device is responsible for managing agents installed on the devices you’d like to monitor.
As mentioned, Wazuh is an EDR; let’s briefly run through what an EDR is. Endpoint detection and response (EDR) are tools and applications that monitor devices for an activity that could indicate a threat or security breach. These tools and applications have features that include:
- Auditing a device for common vulnerabilities
- Proactively monitoring a device for suspicious activity such as unauthorized logins, brute-force attacks, or privilege escalations.
- Visualizing complex data and events into neat and trendy graphs
- Recording a device’s normal operating behaviour to help with detecting anomalies
A sample view of how Wazuh works is shown below.
To experience Wazuh in action, you may refer to the Wazuh Room.
Answer the questions below
Since the answers can be found above, I won’t share the actual answer below. Just where you can find them.
Where do the Windows Event logs (.evtx files) typically reside?
The answer can be found in the Windows Event Logs section. You will find an absolute path that ends with \Logs. Once you find the path, copy and paste it in the TryHackMe answer field, then click Submit.
Provide the command used to enter OSQuery CLI.
Looking under the OSQuery section, you will see a sentence that explains the command needed to start OSQuery on the commandline. Once you find the command, copy and paste it into the TryHackMe answer field, then click Submit.
What does EDR mean? Provide the answer in lowercase.
Looking at the Wazuh section, you will see the acronymn EDR several times. Look for (EDR), when you find it the answer it to the left. Copy and paste the answer into the TryHackMe answer field, then click Submit.
Task 4 Endpoint Log Analysis
Event Correlation
Event correlation identifies significant relationships from multiple log sources such as application logs, endpoint logs, and network logs.
Event correlation deals with identifying significant artefacts co-existing from different log sources and connecting each related artefact. For example, a network connection log may exist in various log sources such as Sysmon logs (Event ID 3: Network Connection) and Firewall Logs. The Firewall log may provide the source and destination IP, source and destination port, protocol, and the action taken. In contrast, Sysmon logs may give the process that invoked the network connection and the user running the process.
With this information, we can connect the dots of each artefact from the two data sources:
- Source and Destination IP
- Source and Destination Port
- Action Taken
- Protocol
- Process name
- User Account
- Machine Name
Event correlation can build the puzzle pieces to complete the exact scenario from an investigation.
Baselining
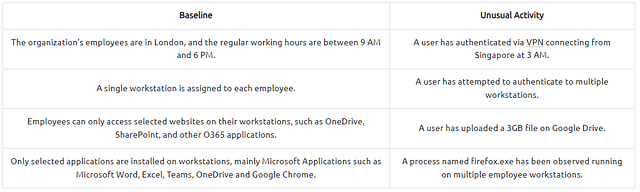
Baselining is the process of knowing what is expected to be normal. In terms of endpoint security monitoring, it requires a vast amount of data-gathering to establish the standard behaviour of user activities, network traffic across infrastructure, and processes running on all machines owned by the organization. Using the baseline as a reference, we can quickly determine the outliers that could threaten the organization.
Below is a sample list of baseline and unusual activities to show the importance of knowing what to expect in your network.
Investigation Activity
We have tackled the foundations of endpoint security monitoring from previous tasks. Now, we will wear our Blue Team Hat and apply the concepts we discussed by investigating a suspicious activity detected on a workstation owned by one of your colleagues.
Answer the questions below
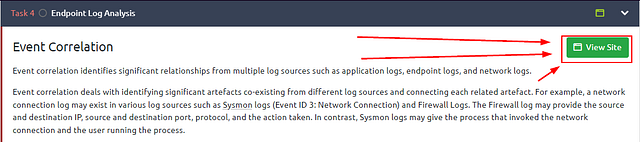
Click on the green View Site button in this task to open the Static Site Lab and start investigating the threat by following the provided instructions.
This is explained well enough above, here is a screenshot to help.
Provide the flag for the simulated investigation activity.
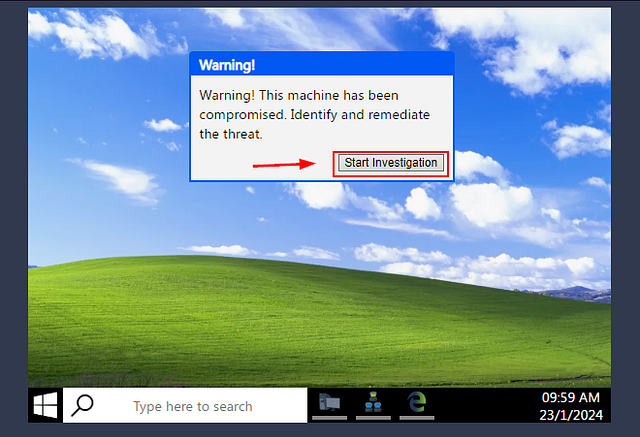
The screen should be split in half now. We can start the investigation by clicking the Start Investigation button that is in the Warning! window.
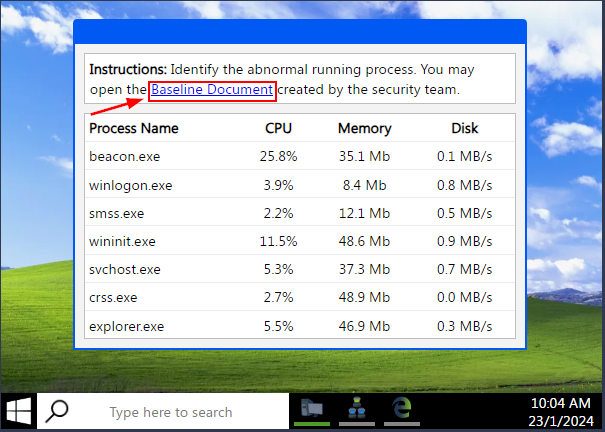
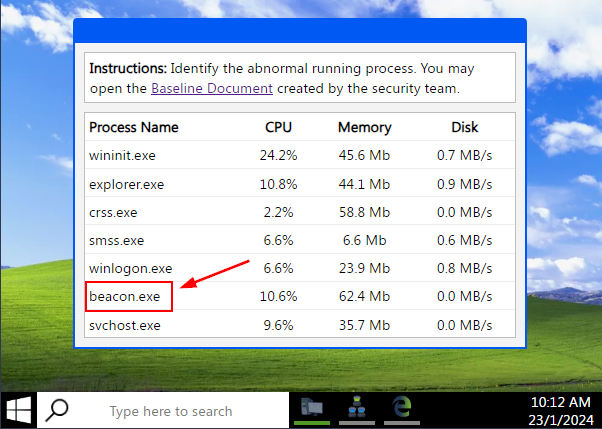
We are now presented with a running Process List. But we first need to know what they system is suppose to run before we can identify the abnormal running process. To do this click on the Baseline Document link.
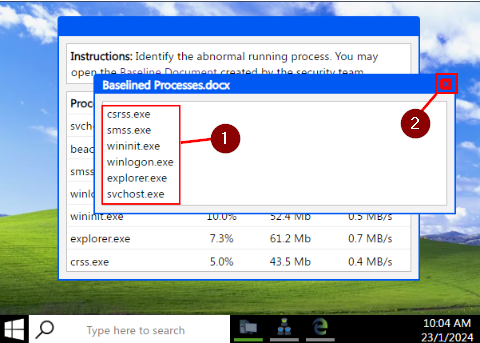
A window will pop up showing the normal processes that run on the system. Using this list, we can compare to see if any other processes are running on this system. When your done, click the X in the top right corner of the window.
Looking over the list of current running processes, we can see beacon.exe wasn’t on the list from our Baseline Processes. This looks to be the abnormal Process, so click on the beacon.exe process.
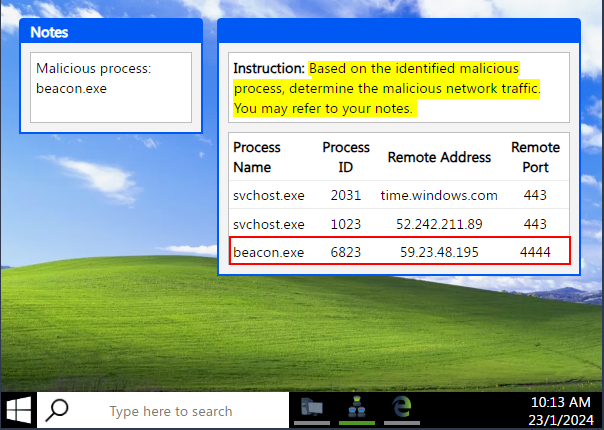
We are now presented with two new windows. The one on the left is showing our Notes related to our investigation. The window on the right is the next step to our investigation. We have to identify the Malicious Network Traffic. We can see two processes named svchost.exe running which look to be typical/normal network traffic. The final one is from the beacon.exe process we named as being Malicious earlier. Now we have some more information about it. We can see the Destination IP address and Destination Port. The Destination Port being 4444 is very suspicious, I believe we have found the Malicious Network Traffic, click on beacon.exe to select it for the investigation.
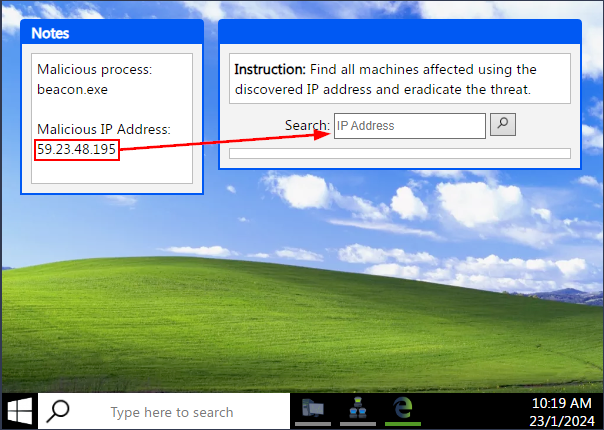
We can now see that the Malicious IP Address has been added to the Notes window. Our next step is to see if any other systems on the Network have made connections with the Malicious IP Address. This can be done by copying and pasting the Malicious IP Address into the Search field of the new window on the right side of the desktop. Press Enter or click the Magnifing Glass icon to search for the Malicious IP Address.
Four other systems were found to have connected with the Malicious IP Address. The next step we need to do is Remediate the issue on said machines. To do this there is a button for each that says Remediate, click on each of these button.
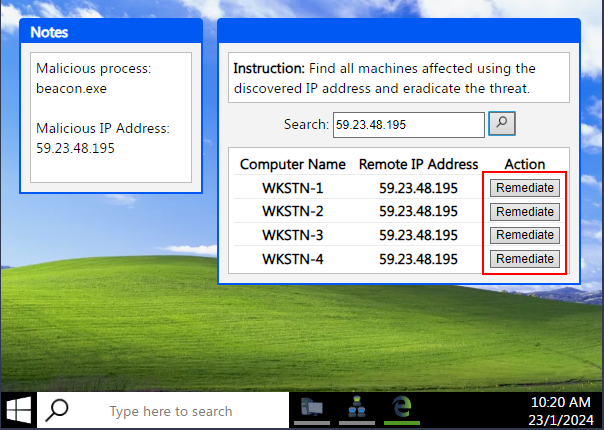
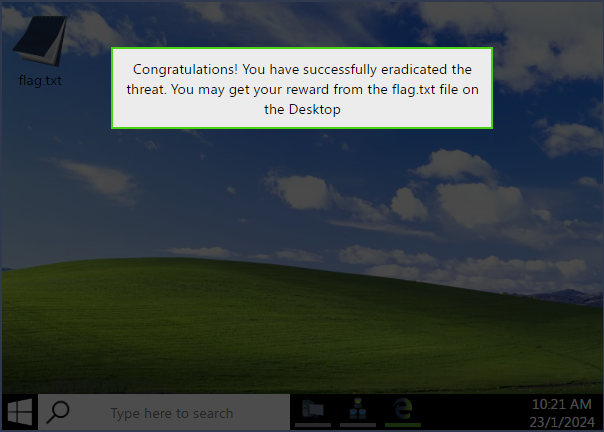
Once you have remediated the issue from the system. You have completed the task and investigation. We are now greated with the message that the flag.txt file is now avaible on the desktop. Click anywhere on the desktop to remove the message.
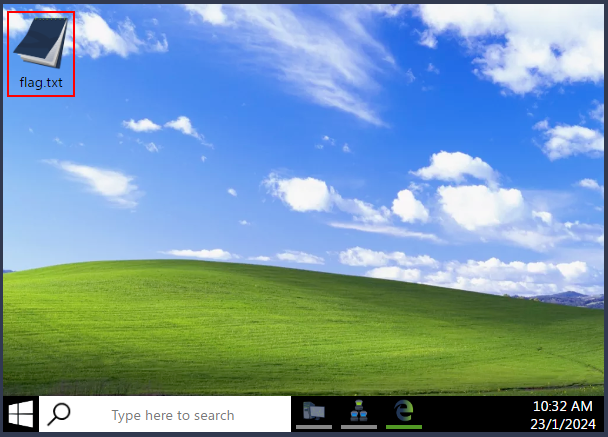
Now we can click on flag.txt, to open the file and get the flag.
A window will pop up on the desktop, revealing the flag. Copy and paste the flag into the TryHackMe answer field, then click Submit.
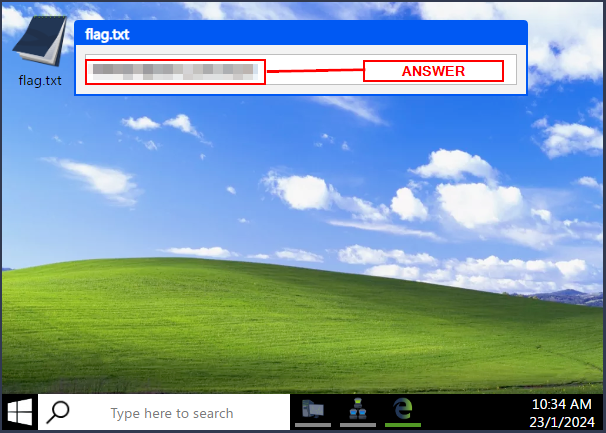
Answer: THM{3ndp01nt_s3cur1ty!}
Task 5 Conclusion
Congratulations! You have completed the investigation task.
In the simulated threat investigation activity, we have learned the following:
- Having a baseline document aids you in differentiating malicious events from benign ones.
- Event correlation provides a deeper understanding of the concurrent events triggered by the malicious activity.
- Taking note of each significant artefact is crucial in the investigation.
- Other potentially affected assets should be inspected and remediated using the collected malicious artefacts.
In conclusion, we covered the basic concepts of Endpoint Security Monitoring:
- Endpoint Security Fundamentals tackled Core Windows Processes and Sysinternals.
- Endpoint Logging and Monitoring introduced logging functionalities such as Windows Event Logging and Sysmon and monitoring/investigation tools such as OSQuery and Wazuh.
- Endpoint Log Analysis highlighted the importance of having a methodology such as baselining and event correlation.
You are now ready to deep-dive into the Endpoint Security Monitoring Module. To continue this path, you may refer to the list of rooms mentioned in the previous tasks: