Learn how to use NetworkMiner to analyse recorded traffic files and practice network forensics activities.
Task 1 Room Introduction

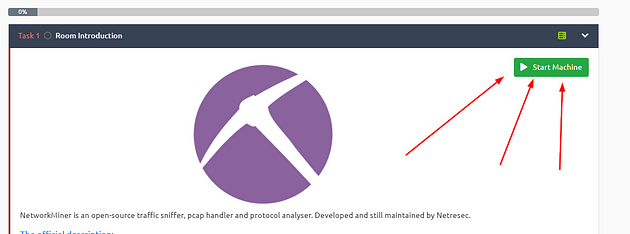
NetworkMiner is an open-source traffic sniffer, pcap handler and protocol analyser. Developed and still maintained by Netresec.
“NetworkMiner is an open source Network Forensic Analysis Tool (NFAT) for Windows (but also works in Linux / Mac OS X / FreeBSD). NetworkMiner can be used as a passive network sniffer/packet capturing tool to detect operating systems, sessions, hostnames, open ports etc. without putting any traffic on the network. NetworkMiner can also parse PCAP files for off-line analysis and to regenerate/reassemble transmitted files and certificates from PCAP files.
NetworkMiner makes it easy to perform advanced Network Traffic Analysis (NTA) by providing extracted artefacts in an intuitive user interface. The way data is presented not only makes the analysis simpler, it also saves valuable time for the analyst or forensic investigator.
NetworkMiner has, since the first release in 2007, become a popular tool among incident response teams as well as law enforcement. NetworkMiner is today used by companies and organizations all over the world.”
For this room, you will be expected to have basic Linux familiarity and Network fundamentals (ports, protocols and traffic data). We suggest completing the “Network Fundamentals” path before starting working in this room.
The room aims to provide a general network forensics overview and work with NetworkMiner to investigate captured traffic.
Note: VMs attached to this challenge. You don’t need SSH or RDP; the room provides a “Split View” feature.
Note: There are two different NetworkMiner versions are available in the attached VM. Use the required version according to the tasks.
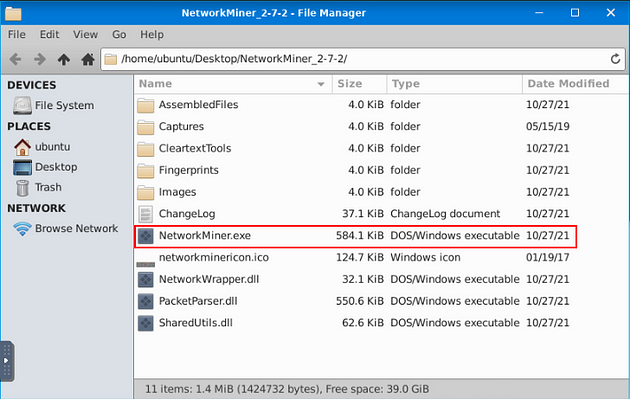
Note: Exercise files are located in the folder on the desktop.
Open the tool folder and double click on the .exe file.
Task 2 Introduction to Network Forensics

Introduction to Network Forensics
Network Forensics is a specific subdomain of the Forensics domain, and it focuses on network traffic investigation. Network Forensics discipline covers the work done to access information transmitted by listening and investigating live and recorded traffic, gathering evidence/artefacts and understanding potential problems.
Briefly, it is the action of recording packets of network traffic and creating investigatable sources and establishing a root–cause analysis of an event. The ultimate goal is to provide sufficient information to detect malicious activities, security breaches, policy/regulation compliance, system health and user behaviour.
The investigation process identifies communicated hosts in terms of time, frequency, protocol, application and data.
The investigation tries to answer the 5W;
- Who (Source IP and port)
- What (Data/payload)
- Where (Destination IP and port)
- When (Time and data)
- Why (How/What happened)
Note that the network evidence capture and investigation process should be systematic. Having enough data and the right timeline capture for a successful network forensics investigation is crucial.
Network Forensics Use Cases
The most common network forensics use cases are explained below;
- Network discovery: Discovering the network to overview connected devices, rogue hosts and network load.
- Packets reassembling: Reassembling the packets to investigate the traffic flow. This use case is helpful in unencrypted traffic flows.
- Data leakage detection: Reviewing packet transfer rates for each host and destination address helps detect possible data leakage.
- Anomaly and malicious activity detection: Reviewing overall network load by focusing on used ports, source and destination addresses, and data helps detect possible malicious activities along with vulnerabilities. This use case covers the correlation of indicators and hypotheses as well.
- Policy/Regulation compliance control: Reviewing overall network behaviour helps detect policy/regulation compliance.
Advantages of Network Forensics
General advantages of network forensics are explained below;
- Availability of network-based evidence in the wild: Capturing network traffic is collecting evidence, so it is easier than other types of evidence collections such as logs and IOCs.
- Ease of data/evidence collection without creating noise: Capturing and working with network traffic is easier than investigating unfiltered events by EDRs, EPPs and log systems. Usually, sniffing doesn’t create much noise, logs and alerts. The other thing is that network traffic is not destructible like logs and alerts generated by security systems.
- It is hard to destroy the network evidence, as it is the transferred data: Since the evidence is the traffic itself, it is impossible to do anything without creating network noise. Still, it is possible to hide the artefacts by encrypting, tunnelling and manipulating the packets. So, the second fact is the challenge of this advantage.
- Availability of log sources: Logs provide valuable information which helps to correlate the chain of events and support the investigation hypothesis. The majority of the EDRs, EPPs and network devices create logs by default. Having log files is easy if the attacker/threat/malware didn’t erase/destroy them.
- It is possible to gather evidence for memory and non-residential malicious activities: The malware/threat might reside in the memory to avoid detection. However, the series of commands and connections live in the network. So it is possible to detect non-residential threats with network forensics tools and tactics.
Challenges of Network Forensics
General challenges of the network forensics are explained below;
- Deciding what to do: One of the most difficult challenges of network forensics is “Deciding what to do”. There are several purposes of carving networks; SOC, IH/IR and Threat Hunting. Observing, trapping, catching, or stopping an anomalous activity is also possible.
- Sufficient data/evidence collection on the network: One of the advantages of network forensics is “Ease of collecting evidence”. However, the breadth of this concept poses a challenge. There are multiple points to consider in data/evidence collection.
- Short data capture: One of the challenges in data/evidence collection. Capturing all network activity is not applicable and operable. So, it is hard always to have the packet captures that covers pre, during and post-event.
- The unavailability of full-packet capture on suspicious events: Continuously capturing, storing and processing full-packets costs time and resources. The inability to have full-packet captures for a long time creates time gaps between captures, resulting in missing a significant part of an event of interest. Sometimes NetFlow captures are used instead of full-packet captures to reduce the weight of having full-packet captures and increase the capture time. Note that full-packet captures provide full packet details and give the opportunity of event reconstruction, while NetFlow provides high-level summary but not data/payload details.
- Encrypted traffic: Encrypted data is another challenge of network forensics. In most cases, discovering the contents of the encrypted data is not possible. However, the encrypted data still can provide valuable information for the hypothesis like source and destination address and used services.
- GDPR and Privacy concerns in traffic recording: Capturing the traffic is the same as “recording everything on the wire”; therefore, this act should comply with GDPR and business-specific regulations (e.g. HIPAA, PCI DSS and FISMA ).
- Nonstandard port usage: One of the popular approaches in network forensics investigations is grabbing the low-hanging fruits in the first investigation step. Looking for commonly used patterns (like known ports and services used in enumeration and exploitation) is known as grabbing the low-hanging fruits. However, sometimes attackers/threats use nonstandard ports and services to avoid detection and bypass security mechanisms. Therefore sometimes, this ends up as a challenge of network forensics.
- Time zone issues: Using a common time zone is important for big-scale event investigation. Especially when working with multiple resources over different time zones, usage of different time zones create difficulties in event correlation.
- Lack of logs: Network forensics is not limited to investigating the network traffic data. Network devices and event logs are crucial in event correlation and investigation hypotheses. This fact is known by the attackers/threats as well; therefore these logs are often erased by them, in order to make the investigation more difficult.
Sources of Network Forensics Evidence
Capturing proper network traffic requires knowledge and tools. Usually, there is a single chance of gathering the live traffic as evidence. There are multiple evidence resources to gather network forensics data.
- TAPS
- InLine Devices
- SPAN Ports
- Hubs
- Switches
- Routers
- DHCP Servers
- Name Servers
- Authentication Servers
- Firewalls
- Web Proxies
- Central Log Servers
- Logs (IDS/IPS, Application, OS, Device)
Primary Purposes of Network Forensics
There are two primary purposes in Network Forensics investigations.
- Security Operations (SOC): Daily security monitoring activities on system performance and health, user behaviour, and security issues.
- Incident Handling/Response and Threat Hunting: During/Post-incident investigation activities on understanding the reason for the incident, detecting malicious and suspicious activity, and investigating the data flow content.
Investigated Data Types in Network Forensics
There are three main data types investigated in Network Forensics
- Live Traffic
- Traffic Captures (full packet captures and network flows)
- Log Files
NetworkMiner is capable of processing and handling packet pictures and live traffic. Therefore, we will focus on live and captured traffic in this room. Both of these data sources are valuable for forensics investigations.
Traffic investigation actions fall under network forensics’s “Traffic Analysis” subdomain. However, the main purpose of the NetworkMiner is to investigate the overall flow/condition of the limited amount of traffic, not for a long in-depth live traffic investigation. Therefore we will focus on how to use NetworkMiner for this purpose. In-depth traffic and packet analysis will be covered in the rooms below;
- Wireshark
- Tcpdump (available soon!)
- Tshark (available soon!)
Task 3 What is NetworkMiner?
NetworkMiner in a Nutshell
We are using NetworkMiner free edition in this room, but a Professional edition has much more features. You can see the differences between free and professional versions here.
Operating Modes
There are two main operating modes;
- Sniffer Mode: Although it has a sniffing feature, it is not intended to use as a sniffer. The sniffier feature is available only on Windows. However, the rest of the features are available in Windows and Linux OS. Based on experience, the sniffing feature is not as reliable as other features. Therefore we suggest not using this tool as a primary sniffer. Even the official description of the tool mentions that this tool is a “Network Forensics Analysis Tool”, but it can be used as a “sniffer”. In other words, it is a Network Forensic Analysis Tool with but has a sniffer feature, but it is not a dedicated sniffer like Wireshark and tcpdump.
- Packet Parsing/Processing: NetworkMiner can parse traffic captures to have a quick overview and information on the investigated capture. This operation mode is mainly suggested to grab the “low hanging fruit” before diving into a deeper investigation.
Pros and Cons
As mentioned in the previous task, NetworkMiner is mainly used to gain an overview of the network. Before starting to investigate traffic data, let’s look at the pros and cons of the NetworkMiner.
Pros
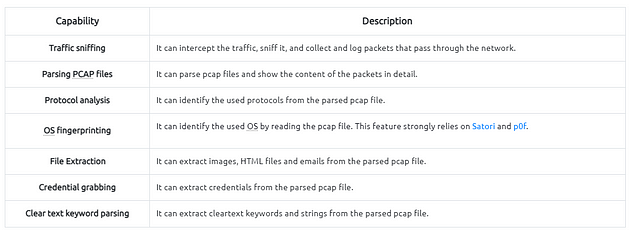
- OS fingerprinting
- Easy file extraction
- Credential grabbing
- Clear text keyword parsing
- Overall overview
Cons
- Not useful in active sniffing
- Not useful for large pcap investigation
- Limited filtering
- Not built for manual traffic investigation
Differences Between Wireshark and NetworkMiner
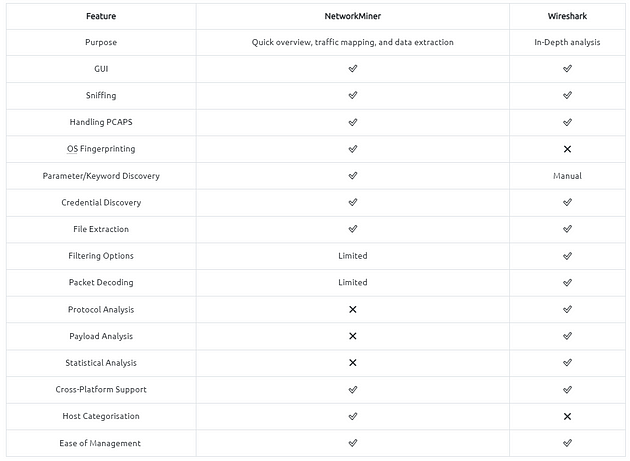
NetworkMiner and Wireshark have similar base features, but they separate in use purpose. Although main functions are identical, some of the features are much stronger for specific use cases.
The best practice is to record the traffic for offline analysis, quickly overview the pcap with NetworkMiner and go deep with Wireshark for further investigation.
Task 4 Tool Overview 1
Getting VM Started
Go back to Task 1, at the top of the task is a green button labled Start Machine. Click the green button to start the VM.
If the screen doesn’t split in half with the VM on the right and Tasks on the left. Then scroll to the top of the page, you will see a Blue button labeled Show Split View, click this button to split the screen.

Time to open NetworkMiner, double-click on the NetworkMiner_2–7–2 folder.
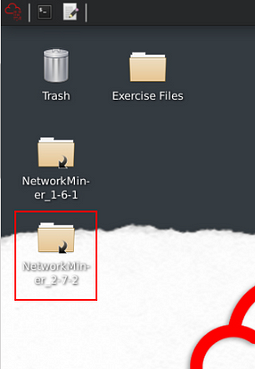
When the directory opens, double-click on NetworkMiner.exe, then give it time to open.
NetworkMiner will open, you are now ready to go along with this Task. See you at the Question.
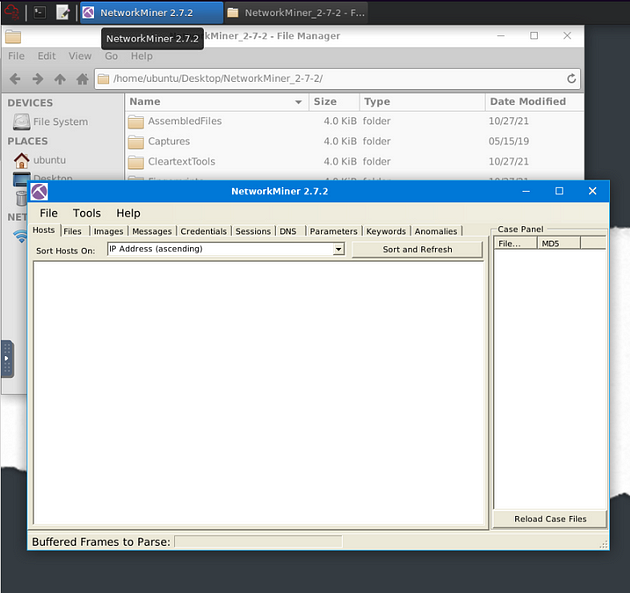
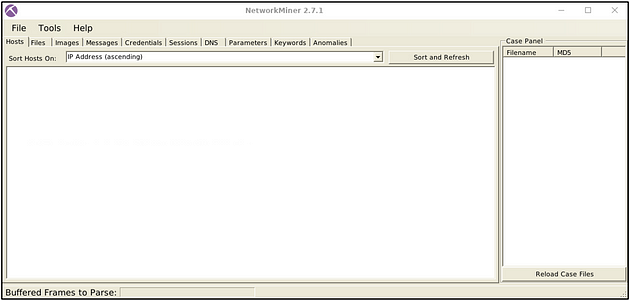
Landing Page
This is the landing page of the NetworkMiner. Once you open the application, this screen loads up.
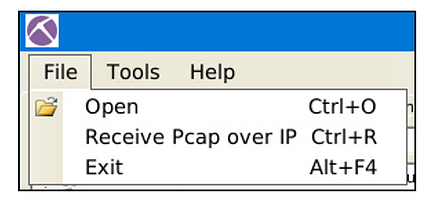
File Menu
The file menu helps you load a Pcap file or receive Pcap over IP. You can also drag and drop pcap files as well.
NetworkMiner also can receive Pcaps over IP. This room suggests using NetworkMiner as an initial investigation tool for low hanging fruit grabbing and traffic overview. Therefore, we will skip receiving Pcaps over IP in this room. You can read on receiving Pcap over IP from here and here.
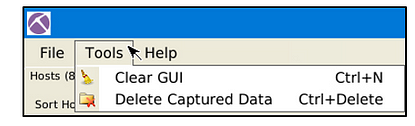
Tools Menu
The tools menu helps you clear the dashboard and remove the captured data.
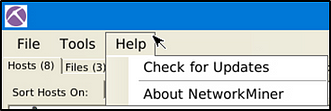
Help Menu
The help menu provides information on updates and the current version.
Case Panel
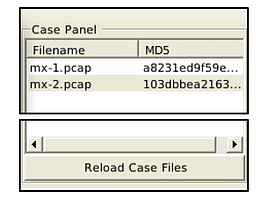
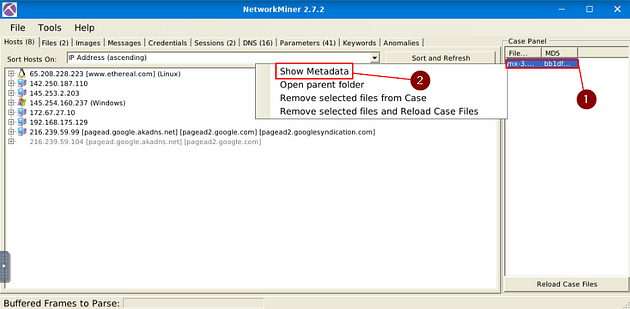
The case panel shows the list of the investigated pcap files. You can reload/refresh, view metadata details and remove loaded files from this panel.
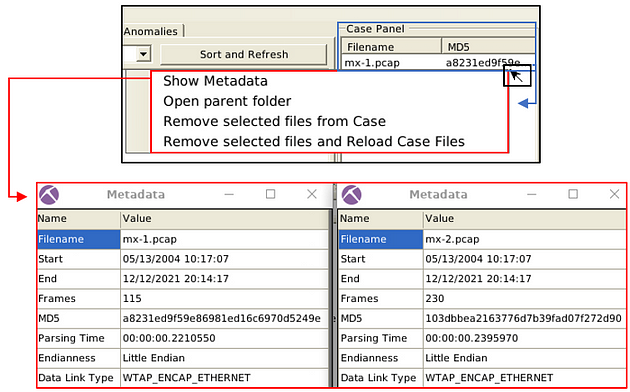
Viewing metadata of loaded files;
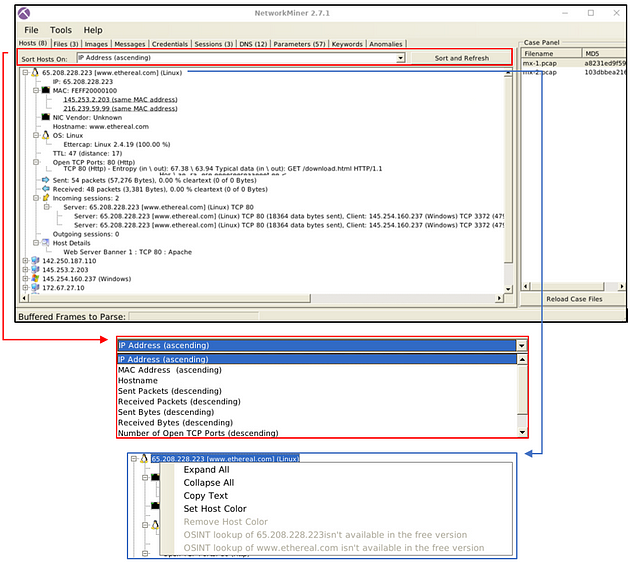
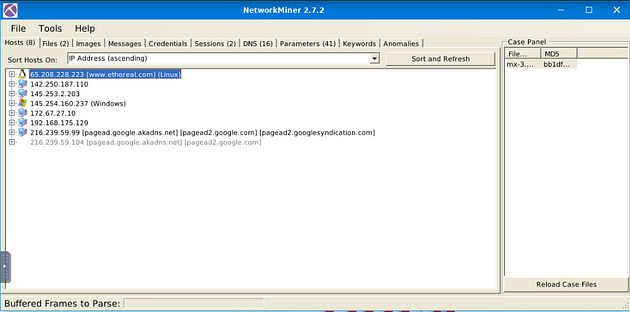
Hosts
The “hosts” menu shows the identified hosts in the pcap file. This section provides information on;
- IP address
- MAC address
- OS type
- Open ports
- Sent/Received packets
- Incoming/Outgoing sessions
- Host details
OS fingerprinting uses the Satori GitHub repo and p0f, and the MAC address database uses the mac-ages GitHub repo.
You can sort the identified hosts by using the sort menu. You can change the colour of the hosts as well. Some of the features (OSINT lookup) are available only in premium mode. The right-click menu also helps you to copy the selected value.
Sessions
The session menu shows detected sessions in the pcap file. This section provides information on;
- Frame number
- Client and server address
- Source and destination port
- Protocol
- Start time
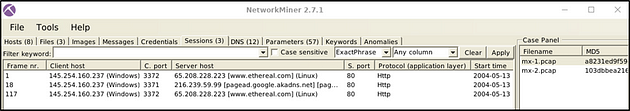
You can search for keywords inside frames with the help of the filtering bar. It is possible to filter specific columns of the session menu as well. This menu accepts four types of inputs;
- “ExactPhrase”
- “AllWords”
- “AnyWord”
- “RegExe”
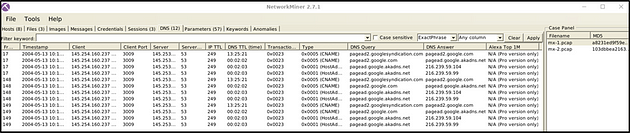
DNS
The DNS menu shows DNS queries with details. This section provides information on;
- Frame number
- Timestamp
- Client and server
- Source and destination port
- IP TTL
- DNS time
- Transaction ID and type
- DNS query and answer
- Alexa Top 1M
Some of the features (Alexa Top 1M) are available only in premium mode. The search bar is available here as well.
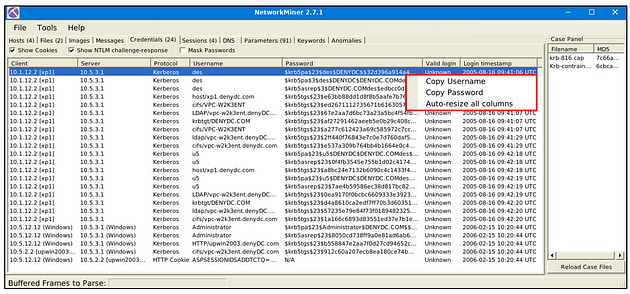
Credentials
The credentials menu shows extracted credentials and password hashes from investigated pcaps. You can use Hashcat (GitHub) and John the Ripper (GitHub) to decrypt extracted credentials. NetworkMiner can extract credentials including;
- Kerberos hashes
- NTLM hashes
- RDP cookies
- HTTP cookies
- HTTP requests
- IMAP
- FTP
- SMTP
- MS SQL
The right-click menu is helpful in this part as well. You can easily copy the username and password values.
Answer the questions below
Use mx-3.pcap
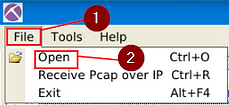
In NetworkMiner, at the top left of the window is the File Tab. Click it, a dropt-down menu will appear, click the Open tab.
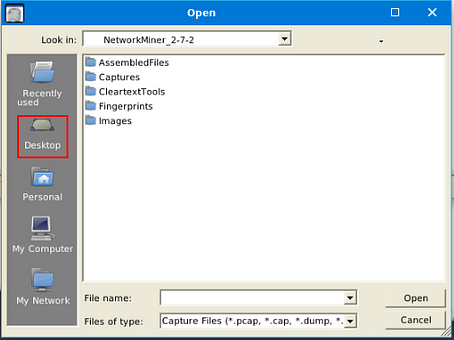
A window will pop-up, and you will be in your current directory. On the left side of this window is a quick find bar, click on the Desktop icon.
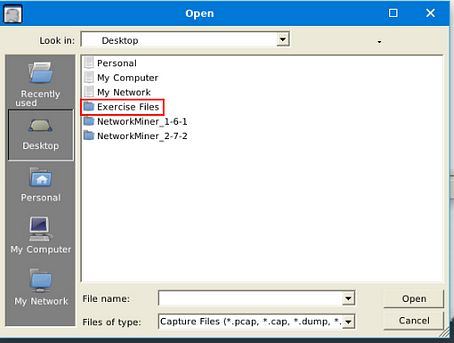
Double-click on the Exercise Files.
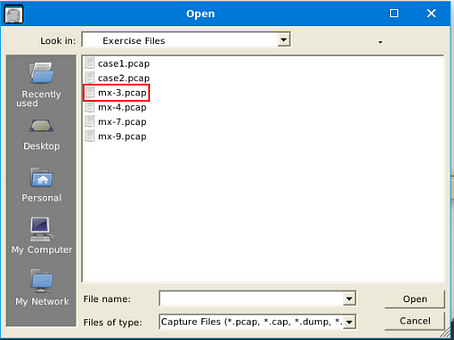
Double-click on th emx-3.pcap file, this will open it in NetworkMiner.
You are now ready to start finding answers to the questions.
What is the total number of frames?
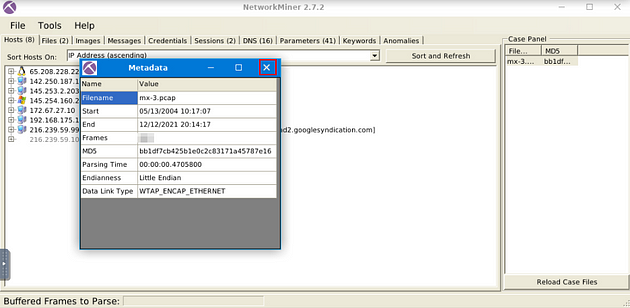
On the right side of the NetworkMiner window, you will see the Case Panel. Inside this panel will be the pcap file we just loaded. Right-click on the file, a drop-down menu will appear. On this menu, you will see Show Metadata, click on this tab.
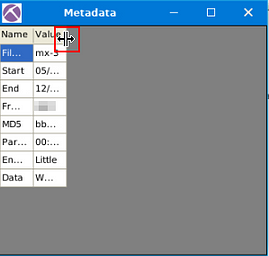
The Metadata window will pop-up, you might need to expand the table, as I had too. Go the right edge of the Value column, when your cursor changes to how it is below, you can click and drag the edge of the table out to expand it. After doing this to the Value column, do the same thing to the Name Column.
After expanding the table, you will see in the Name column Frames in the fourth row down. Look at the Value of this row, this is the answer to the question. Once you find it, type the answer in the TryHackMe answer field, then click submit.
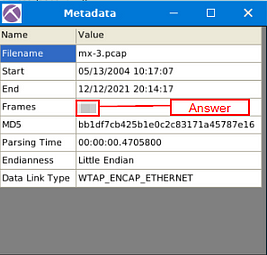
Answer: 460
How many IP addresses use the same MAC address with host 145.253.2.203?
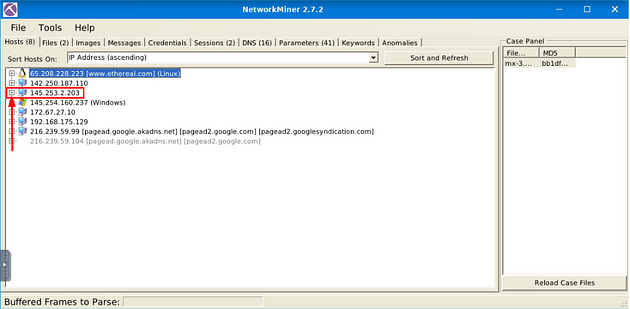
Head back to NetworkMiner, close out of the Metadata window with the X button in the top right.
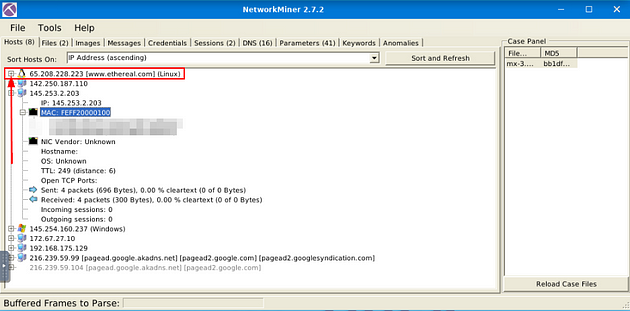
You should already be in the Host tab, look down through the IP address till you find the IP address mentioned in the question. Once you find it click the small + icon on the left side of it to expand the IP address and give you more information.
Just like with the IP address, look down through till you find MAC. Once you find it, there will be once again a small + icon. Click this icon to expand the MAC adress.
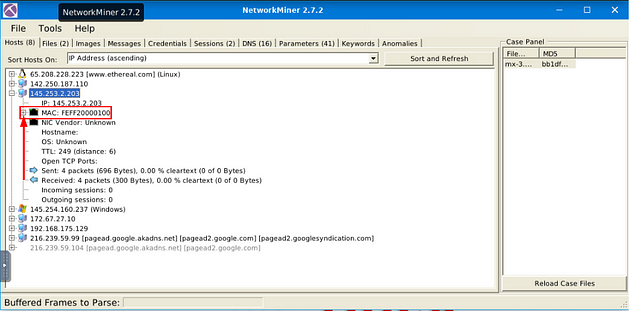
After expanding the MAC address section, count the number of MAC address that in the parathensis say Same MAC addresses. After you have the count, type the answer into the TryHackMe answer field, then click submit.
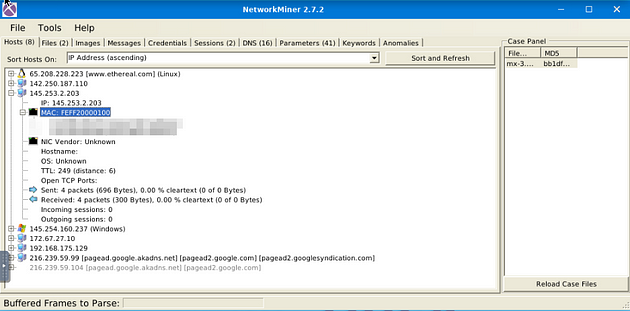
Answer: 2
How many packets were sent from host 65.208.228.223?
Head back to NetworkMiner, this time look for the IP address mentioned in the question. Once you find it click the small + icon on the left side of it to expand the IP address and give you more information.
Look down through till you get to the Sent section, the first number in this section is the answer to the question. Once you find it, type the answer in the TryHackMe answer field, then click submit.
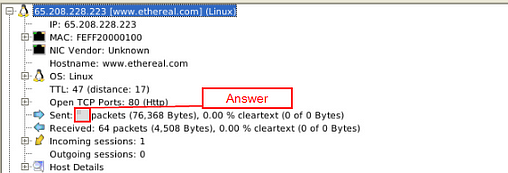
Answer: 72
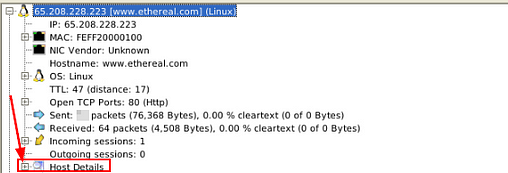
What is the name of the webserver banner under host 65.208.228.223?
Staying in information as the previous quesiton, look at the last section labeled Host Details. Click the small + icon to expand the Host Details section.
The answer can be found at the end of the information in the expanded Host Details section. Once you find it, type the answer in the TryHackMe answer field, then click submit.
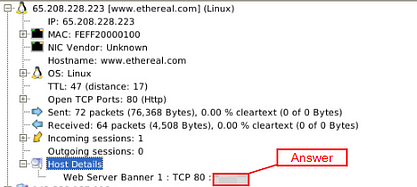
Answer: Apache
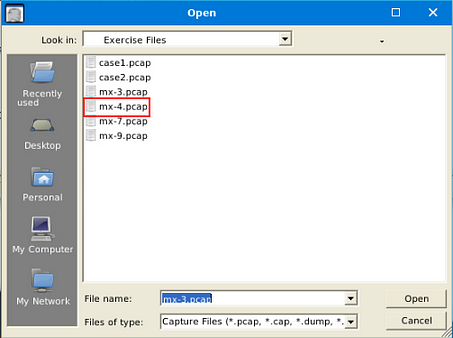
Use mx-4.pcap
In NetworkMiner, at the top left of the window is the File Tab. Click it, a dropt-down menu will appear, click the Open tab.
A window will pop-up, and you will be in your the directory that you last used, which will be the one we need. Double-Click on mx-4.pcap to open it in NetworkMiner.
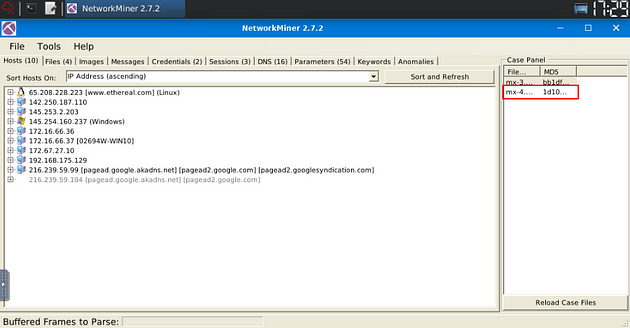
After opening the file, you will see it appears in the Case Panel on the right. You are now ready to answer the rest of the questions.
What is the extracted username?
Look for Credentials Menu tab, when you find it, click on it.
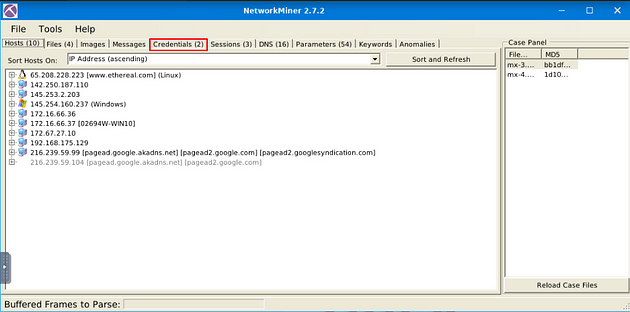
Once on this tab, look
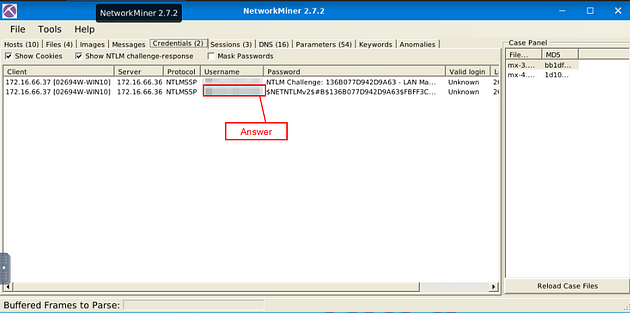
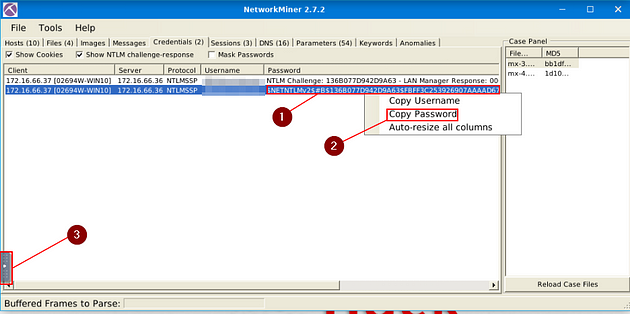
What is the extracted password?
Staying on the Credentials Menu Tab, look to the Password column, which is to the right of the Username column. Right-click on the Password, on the drop-down menu click Copy Password. Then there is a small Grey Tab in the middle of the VM. Click this tab.
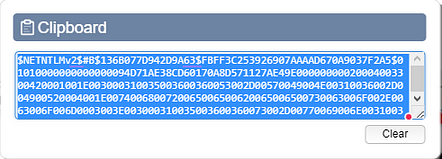
Click the clipboard icon on the pop-out bar.

A Clipboard window will pop-up, click inside the text box. Then use the keyboard shortcut ctrl + a to hightlight all the text inside the box. Then copy (ctrl + c) and paste (ctrl + v) in the TryHackMe answer field, then click submit.
Not the Answer: Markdown didn’t like the answer format so I won’t be positng it here
You have finished these tasks, and can now move onto Task 5 Tool Overview 2 & Task 6 Version Differences.