If you haven’t done task 1, 2, & 3 yet, here is the link to my write-up it: Task 1 Introduction, Task 2 Interactive Material and VM, & Task 3 Introduction to IDS/IPS.
Getting the VM Started
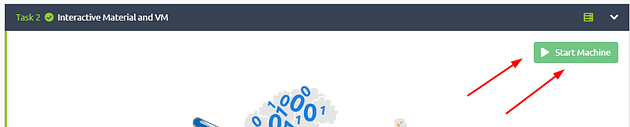
If you don’t have the VM started or running, head back to task 2. Once there click on the green button labeled Start Machine, in the top right of the task.
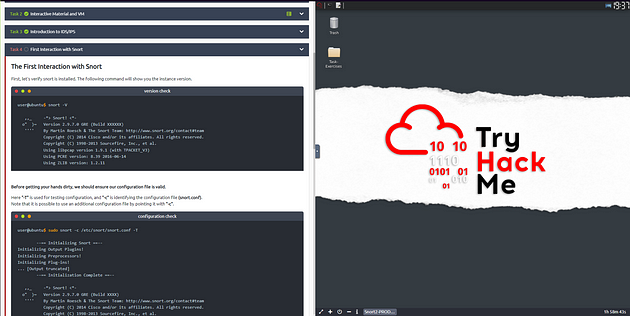
The screen should spit in half, if not scroll to the top of the page. You will see a blue button labeled Show Split View. Click this button to split the screen in half, with the TryHackMe room being on the Left and the Linux VM on the right

Getting the Terminal
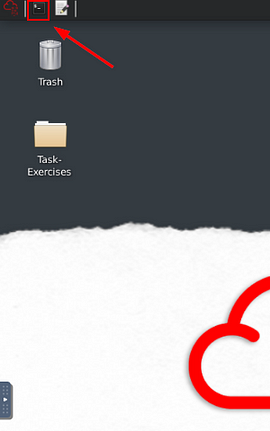
Now before we can start, we need a terminal. On our Linux VM, you can find the terminal icon in the top left. Click the icon to open a terminal window.
The terminal window will appear on the Linux VM screen.
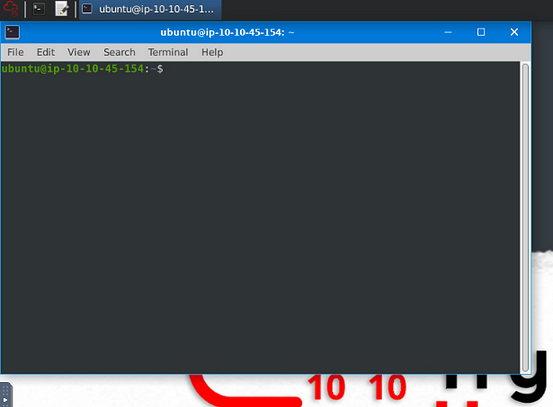
Now you are ready to start the taskes ahead of you!!!!
Task 4 First Interaction with Snort
The First Interaction with Snort
First, let’s verify snort is installed. The following command will show you the instance version.
version check
user@ubuntu$ snort -V
,,_ -> Snort! <-
o” )~ Version 2.9.7.0 GRE (Build XXXXXX)
‘’’’ By Martin Roesch & The Snort Team: http://www.snort.org/contact#team
Copyright (C) 2014 Cisco and/or its affiliates. All rights reserved.
Copyright (C) 1998-2013 Sourcefire, Inc., et al.
Using libpcap version 1.9.1 (with TPACKET_V3)
Using PCRE version: 8.39 2016-06-14
Using ZLIB version: 1.2.11
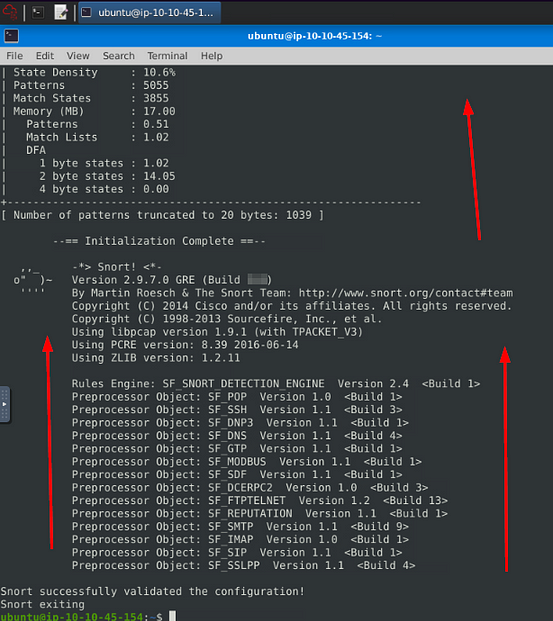
Before getting your hands dirty, we should ensure our configuration file is valid.
Here “-T” is used for testing configuration, and “-c” is identifying the configuration file (snort.conf).
Note that it is possible to use an additional configuration file by pointing it with “-c”.
configuration check
user@ubuntu$ sudo snort -c /etc/snort/snort.conf -T
–== Initializing Snort ==–
Initializing Output Plugins!
Initializing Preprocessors!
Initializing Plug-ins!
… [Output truncated]
–== Initialization Complete ==–
,,_ -> Snort! <-
o” )~ Version 2.9.7.0 GRE (Build XXXX)
‘’’’ By Martin Roesch & The Snort Team: http://www.snort.org/contact#team
Copyright (C) 2014 Cisco and/or its affiliates. All rights reserved.
Copyright (C) 1998-2013 Sourcefire, Inc., et al.
Using libpcap version 1.9.1 (with TPACKET_V3)
Using PCRE version: 8.39 2016-06-14
Using ZLIB version: 1.2.11
Rules Engine: SF_SNORT_DETECTION_ENGINE Version 2.4
Preprocessor Object: SF_GTP Version 1.1
Preprocessor Object: SF_SIP Version 1.1
Preprocessor Object: SF_SSH Version 1.1
Preprocessor Object: SF_SMTP Version 1.1
Preprocessor Object: SF_POP Version 1.0
Preprocessor Object: SF_DCERPC2 Version 1.0
Preprocessor Object: SF_IMAP Version 1.0
Preprocessor Object: SF_DNP3 Version 1.1
Preprocessor Object: SF_SSLPP Version 1.1
Preprocessor Object: SF_MODBUS Version 1.1
Preprocessor Object: SF_SDF Version 1.1
Preprocessor Object: SF_REPUTATION Version 1.1
Preprocessor Object: SF_DNS Version 1.1
Preprocessor Object: SF_FTPTELNET Version 1.2
… [Output truncated]
Snort successfully validated the configuration!
Snort exiting
Once we use a configuration file, snort got much more power! The configuration file is an all-in-one management file of the snort. Rules, plugins, detection mechanisms, default actions and output settings are identified here. It is possible to have multiple configuration files for different purposes and cases but can only use one at runtime.
Note that every time you start the Snort, it will automatically show the default banner and initial information about your setup. You can prevent this by using the “-q” parameter.
That was an easy one; let’s continue exploring snort modes!
Answer the questions below
Run the Snort instance and check the build number.
Time to run some commands, let’s start with the one that TryHackMe first gave us for snort, snort -V .

Looking through the information giving we can see we have the Build number!!! Once you find it, type the answer in the TryHackMe answer field, then click submit.
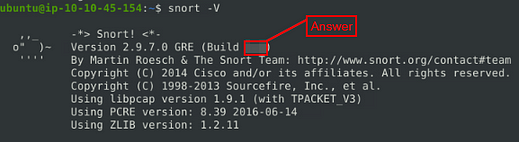
Answer: 149
Test the current instance with “/etc/snort/snort.conf” file and check how many rules are loaded with the current build.
In this case we are going to run the second command given to us by TryHackMe, sudo snort -c /etc/snort/snort.conf -T . Then press enter to run it.

As before, we get quite the output, but we don’t see any number of rules here so time to start scrolling up.
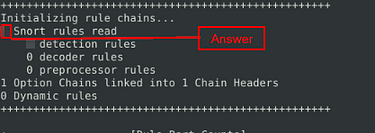
Right before we get to the section where every line starts with Warning. We see a small section, the top line has a number then Snort rules read. The number at the front of this top line is the answer to the question. Once you find it, type the answer in the TryHackMe answer field, then click submit.
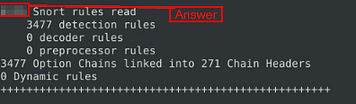
Answer: 4151
Test the current instance with “/etc/snort/snortv2.conf” file and check how many rules are loaded with the current build.
So we are going to run almost the same command as the previous question, but we need to change the config file. So the syntax is, sudo snort -c /etc/snort/snortv2.conf -T . Then press enter to run the command.

After it has finished running, scroll up to the section similar to where we found the answer to the previous question, to find the answer to this quesiton. Once you find it, type the answer in the TryHackMe answer field, then click submit.
Answer: 1
Task 5 Operation Mode 1: Sniffer Mode

Let’s run Snort in Sniffer Mode
Like tcpdump, Snort has various flags capable of viewing various data about the packet it is ingesting.
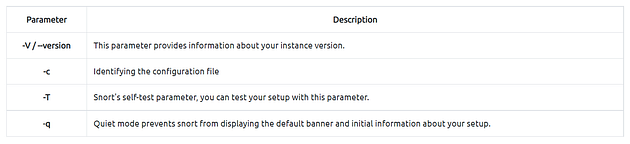
Sniffer mode parameters are explained in the table below;
ParameterDescription:
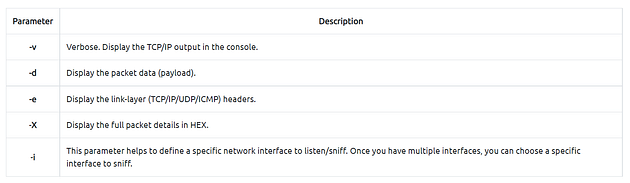
-iThis parameter helps to define a specific network interface to listen/sniff. Once you have multiple interfaces, you can choose a specific interface to sniff.
Let’s start using each parameter and see the difference between them. Snort needs active traffic on your interface, so we need to generate traffic to see Snort in action.
To do this, use the traffic-generator script (find this in the Task-Exercise folder)
Sniffing with parameter “-i”
Start the Snort instance in verbose mode (-v) and use the interface (-i) “eth0”; sudo snort -v-i eth0
In case you have only one interface, Snort uses it by default. The above example demonstrates to sniff on the interface named “eth0”. Once you simulate the parameter -v, you will notice it will automatically use the “eth0” interface and prompt it.
Sniffing with parameter “-v”
Start the Snort instance in verbose mode (-v); sudo snort -v
Now run the traffic-generator script as sudo and start ICMP/HTTP traffic. Once the traffic is generated, snort will start showing the packets in verbosity mode as follows;
sniffing with -v
user@ubuntu$ sudo snort -v
Running in packet dump mode
` –== Initializing Snort ==– ` ... Commencing packet processing (pid=64) 12/01-20:10:13.846653 192.168.175.129:34316 -> 192.168.175.2:53 UDP TTL:64 TOS:0x0 ID:23826 IpLen:20 DgmLen:64 DF Len: 36 =+=+=+=+=+=+=+=+=+=+=+=+=+=+=+=+=+=+=+=+=+=+=+=+=+=+=+=+=+=+=+=+=+=+=+=+=+ 12/01-20:10:13.846794 192.168.175.129:38655 -> 192.168.175.2:53 UDP TTL:64 TOS:0x0 ID:23827 IpLen:20 DgmLen:64 DF Len: 36 =============================================================================== Snort exiting
As you can see in the given output, verbosity mode provides tcpdump like output information. Once we interrupt the sniffing with CTRL+C, it stops and summarises the sniffed packets.
Sniffing with parameter “-d”
Start the Snort instance in dumping packet data mode (-d); sudo snort -d
Now run the traffic-generator script as sudo and start ICMP/HTTP traffic. Once the traffic is generated, snort will start showing the packets in verbosity mode as follows;
sniffing with -d
user@ubuntu$ sudo snort -d
Running in packet dump mode
--== Initializing Snort ==--
... Commencing packet processing (pid=67) 12/01-20:45:42.068675 192.168.175.129:37820 -> 192.168.175.2:53 UDP TTL:64 TOS:0x0 ID:53099 IpLen:20 DgmLen:56 DF Len: 28
99 A5 01 00 00 01 00 00 00 00 00 00 06 67 6F 6F .............goo 67 6C 65 03 63 6F 6D 00 00 1C 00 01 gle.com..... =+=+=+=+=+=+=+=+=+=+=+=+=+=+=+=+=+=+=+=+=+=+=+=+=+=+=+=+=+=+=+=+=+=+=+=+=+
WARNING: No preprocessors configured for policy 0. 12/01-20:45:42.070742 192.168.175.2:53 -> 192.168.175.129:44947
UDP TTL:128 TOS:0x0 ID:63307 IpLen:20 DgmLen:72
Len: 44 FE 64 81 80 00 01 00 01 00 00 00 00 06 67 6F 6F .d...........goo 67 6C 65 03 63 6F 6D 00 00 01 00 01 C0 0C 00 01 gle.com......... 00 01 00 00 00 05 00 04 D8 3A CE CE .........:.. =+=+=+=+=+=+=+=+=+=+=+=+=+=+=+=+=+=+=+=+=+=+=+=+=+=+=+=+=+=+=+=+=+=+=+=+=+
As you can see in the given output, packet data payload mode covers the verbose mode and provides more data.
Sniffing with parameter “-de”
Start the Snort instance in dump (-d) and link-layer header grabbing (-e) mode; snort -d -e
Now run the traffic-generator script as sudo and start ICMP/HTTP traffic. Once the traffic is generated, snort will start showing the packets in verbosity mode as follows;
sniffing with -de
user@ubuntu$ sudo snort -de
Running in packet dump mode ` –== Initializing Snort ==– ` ... Commencing packet processing (pid=70)
12/01-20:55:26.958773 00:0C:29:A5:B7:A2 -> 00:50:56:E1:9B:9D type:0x800 len:0x46 192.168.175.129:47395 -> 192.168.175.2:53 UDP TTL:64 TOS:0x0 ID:64294 IpLen:20 DgmLen:56 DF
Len: 28 6D 9C 01 00 00 01 00 00 00 00 00 00 06 67 6F 6F m............goo 67 6C 65 03 63 6F 6D 00 00 01 00 01 gle.com..... =+=+=+=+=+=+=+=+=+=+=+=+=+=+=+=+=+=+=+=+=+=+=+=+=+=+=+=+=+=+=+=+=+=+=+=+=+
WARNING: No preprocessors configured for policy 0. 12/01-20:55:26.965226 00:50:56:E1:9B:9D -> 00:0C:29:A5:B7:A2 type:0x800 len:0x56
192.168.175.2:53 -> 192.168.175.129:47395 UDP TTL:128 TOS:0x0 ID:63346 IpLen:20 DgmLen:72
Len: 44 6D 9C 81 80 00 01 00 01 00 00 00 00 06 67 6F 6F m............goo 67 6C 65 03 63 6F 6D 00 00 01 00 01 C0 0C 00 01 gle.com......... 00 01 00 00 00 05 00 04 D8 3A D6 8E .........:..
Sniffing with parameter “-X”
Start the Snort instance in full packet dump mode (-X); sudo snort -X
Now run the traffic-generator script as sudo and start ICMP/HTTP traffic. Once the traffic is generated, snort will start showing the packets in verbosity mode as follows;
sniffing with -X
user@ubuntu$ sudo snort -X
Running in packet dump mode ` –== Initializing Snort ==– ` ... Commencing packet processing (pid=76) WARNING: No preprocessors configured for policy 0. 12/01-21:07:56.806121 192.168.175.1:58626 -> 239.255.255.250:1900 UDP TTL:1 TOS:0x0 ID:48861 IpLen:20 DgmLen:196 Len: 168 0x0000: 01 00 5E 7F FF FA 00 50 56 C0 00 08 08 00 45 00 ..^....PV.....E. 0x0010: 00 C4 BE DD 00 00 01 11 9A A7 C0 A8 AF 01 EF FF ................ 0x0020: FF FA E5 02 07 6C 00 B0 85 AE 4D 2D 53 45 41 52 .....l....M-SEAR 0x0030: 43 48 20 2A 20 48 54 54 50 2F 31 2E 31 0D 0A 48 CH * HTTP/1.1..H 0x0040: 4F 53 54 3A 20 32 33 39 2E 32 35 35 2E 32 35 35 OST: 239.255.255 0x0050: 2E 32 35 30 3A 31 39 30 30 0D 0A 4D 41 4E 3A 20 .250:1900..MAN: 0x0060: 22 73 73 64 70 3A 64 69 73 63 6F 76 65 72 22 0D "ssdp:discover". 0x0070: 0A 4D 58 3A 20 31 0D 0A 53 54 3A 20 75 72 6E 3A .MX: 1..ST: urn: 0x0080: 64 69 61 6C 2D 6D 75 6C 74 69 73 63 72 65 65 6E dial-multiscreen 0x0090: 2D 6F 72 67 3A 73 65 72 76 69 63 65 3A 64 69 61 -org:service:dia 0x00A0: 6C 3A 31 0D 0A 55 53 45 52 2D 41 47 45 4E 54 3A l:1..USER-AGENT: 0x00B0: 20 43 68 72 6F 6D 69 75 6D 2F 39 35 2E 30 2E 34 Chromium/95.0.4 0x00C0: 36 33 38 2E 36 39 20 57 69 6E 64 6F 77 73 0D 0A 638.69 Windows.. 0x00D0: 0D 0A .. =+=+=+=+=+=+=+=+=+=+=+=+=+=+=+=+=+=+=+=+=+=+=+=+=+=+=+=+=+=+=+=+=+=+=+=+=+ WARNING: No preprocessors configured for policy 0. 12/01-21:07:57.624205 216.58.214.142 -> 192.168.175.129 ICMP TTL:128 TOS:0x0 ID:63394 IpLen:20 DgmLen:84 Type:0 Code:0 ID:15 Seq:1 ECHO REPLY 0x0000: 00 0C 29 A5 B7 A2 00 50 56 E1 9B 9D 08 00 45 00 ..)....PV.....E. 0x0010: 00 54 F7 A2 00 00 80 01 24 13 D8 3A D6 8E C0 A8 .T......$..:.... 0x0020: AF 81 00 00 BE B6 00 0F 00 01 2D E4 A7 61 00 00 ..........-..a.. 0x0030: 00 00 A4 20 09 00 00 00 00 00 10 11 12 13 14 15 ... ............ 0x0040: 16 17 18 19 1A 1B 1C 1D 1E 1F 20 21 22 23 24 25 .......... !"#$% 0x0050: 26 27 28 29 2A 2B 2C 2D 2E 2F 30 31 32 33 34 35 &'()*+,-./012345 0x0060: 36 37 67 =+=+=+=+=+=+=+=+=+=+=+=+=+=+=+=+=+=+=+=+=+=+=+=+=+=+=+=+=+=+=+=+=+=+=+=+=+
Note that you can use the parameters both in combined and separated form as follows;
- snort -v
- snort -vd
- snort -de
- snort -v -d -e
- snort -X
Make sure you understand and practice each parameter with different types of traffic and discover your favourite combination.
Task 6 Operation Mode 2: Packet Logger Mode

Let’s run Snort in Logger Mode
You can use Snort as a sniffer and log the sniffed packets via logger mode. You only need to use the packet logger mode parameters, and Snort does the rest to accomplish this.
Packet logger parameters are explained in the table below;
ParameterDescription-l
Logger mode, target log and alert output directory. Default output folder is /var/log/snort
The default action is to dump as tcpdump format in /var/log/snort
-K ASCIILog packets in ASCII format.-rReading option, read the dumped logs in Snort.
-nSpecify the number of packets that will process/read. Snort will stop after reading the specified number of packets.
Let’s start using each parameter and see the difference between them. Snort needs active traffic on your interface, so we need to generate traffic to see Snort in action.
Logfile Ownership
Before generating logs and investigating them, we must remember the Linux file ownership and permissions. No need to deep dive into user types and permissions. The fundamental file ownership rule; whoever creates a file becomes the owner of the corresponding file.
Snort needs superuser (root) rights to sniff the traffic, so once you run the snort with the “sudo” command, the “root” account will own the generated log files. Therefore you will need “root” rights to investigate the log files. There are two different approaches to investigate the generated log files;
- Elevation of privileges — You can elevate your privileges to examine the files. You can use the “sudo” command to execute your command as a superuser with the following command
sudo command. You can also elevate the session privileges and switch to the superuser account to examine the generated log files with the following command:sudo su - Changing the ownership of files/directories — You can also change the ownership of the file/folder to read it as your user:
sudo chown username fileorsudo chown username -R directoryThe “-R” parameter helps recursively process the files and directories.
Logging with parameter “-l”
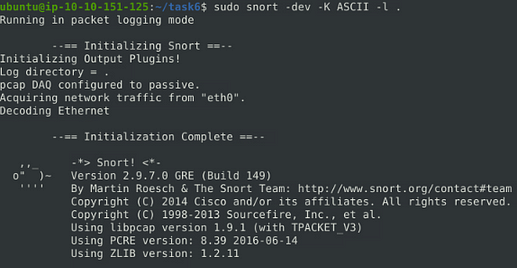
First, start the Snort instance in packet logger mode; sudo snort -dev -l .
Now start ICMP/HTTP traffic with the traffic-generator script.
Once the traffic is generated, Snort will start showing the packets and log them in the target directory. You can configure the default output directory in snort.config file. However, you can use the “-l” parameter to set a target directory. Identifying the default log directory is useful for continuous monitoring operations, and the “-l” parameter is much more useful for testing purposes.
The -l . part of the command creates the logs in the current directory. You will need to use this option to have the logs for each exercise in their folder.
logging with -l
user@ubuntu$ sudo snort -dev -l .
Running in packet logging mode ` –== Initializing Snort ==– ` Initializing Output Plugins! Log directory = /var/log/snort pcap DAQ configured to passive. Acquiring network traffic from "ens33". Decoding Ethernet ` –== Initialization Complete ==– ` ... Commencing packet processing (pid=2679) WARNING: No preprocessors configured for policy 0. WARNING: No preprocessors configured for policy 0.
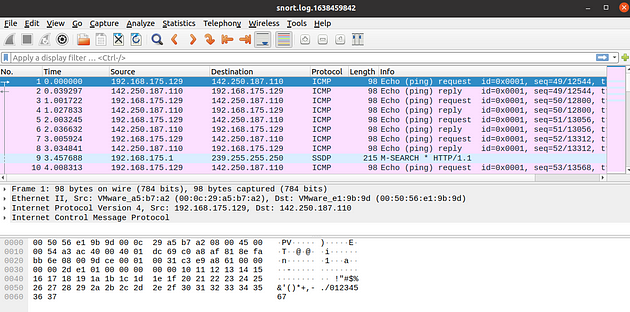
Now, let’s check the generated log file. Note that the log file names will be different in your case.
checking the log file
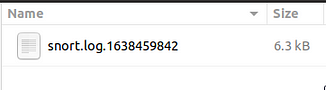
user@ubuntu$ ls .
snort.log.1638459842
As you can see, it is a single all-in-one log file. It is a binary/tcpdump format log. This is what it looks like in the folder view.
Logging with parameter “-K ASCII”
Start the Snort instance in packet logger mode; sudo snort -dev -K ASCII
Now run the traffic-generator script as sudo and start ICMP/HTTP traffic. Once the traffic is generated, Snort will start showing the packets in verbosity mode as follows;
logging with -K ASCII
user@ubuntu$ sudo snort -dev -K ASCII -l .
Running in packet logging mode ` –== Initializing Snort ==– ` Initializing Output Plugins! Log directory = /var/log/snort pcap DAQ configured to passive. Acquiring network traffic from "ens33". Decoding Ethernet ` –== Initialization Complete ==– ` ... Commencing packet processing (pid=2679) WARNING: No preprocessors configured for policy 0. WARNING: No preprocessors configured for policy 0.
Now, let’s check the generated log file.
Checking the log file
user@ubuntu$ ls .
142.250.187.110 192.168.175.129 snort.log.1638459842
This is what it looks like in the folder view.
The logs created with “-K ASCII” parameter is entirely different. There are two folders with IP address names. Let’s look into them.
checking the log file
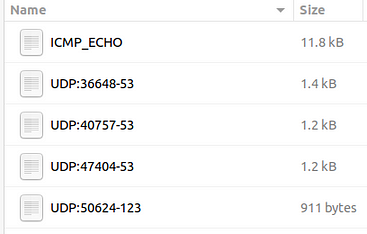
user@ubuntu$ ls ./192.168.175.129/
ICMP_ECHO UDP:36648-53 UDP:40757-53 UDP:47404-53 UDP:50624-123
Once we look closer at the created folders, we can see that the logs are in ASCII and categorised format, so it is possible to read them without using a Snort instance.
This is what it looks like in the folder view.
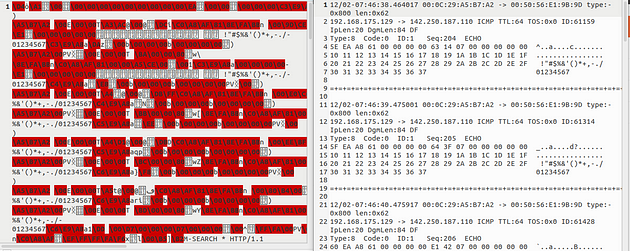
In a nutshell, ASCII mode provides multiple files in human-readable format, so it is possible to read the logs easily by using a text editor. By contrast with ASCII format, binary format is not human-readable and requires analysis using Snort or an application like tcpdump.
Let’s compare the ASCII format with the binary format by opening both of them in a text editor. The difference between the binary log file and the ASCII log file is shown below. (Left side: binary format. Right side: ASCII format).
Reading generated logs with parameter “-r”
Start the Snort instance in packet reader mode; sudo snort -r
reading log files with -r
user@ubuntu$ sudo snort -r snort.log.1638459842
Running in packet dump mode ` –== Initializing Snort ==– ` Initializing Output Plugins! pcap DAQ configured to read-file. Acquiring network traffic from "snort.log.1638459842". ` –== Initialization Complete ==– ` ... Commencing packet processing (pid=3012) WARNING: No preprocessors configured for policy 0. 12/02-07:44:03.123225 192.168.175.129 -> 142.250.187.110 ICMP TTL:64 TOS:0x0 ID:41900 IpLen:20 DgmLen:84 DF Type:8 Code:0 ID:1 Seq:49 ECHO =+=+=+=+=+=+=+=+=+=+=+=+=+=+=+=+=+=+=+=+=+=+=+=+=+=+=+=+=+=+=+=+=+=+=+=+=+ WARNING: No preprocessors configured for policy 0. 12/02-07:44:26.169620 192.168.175.129 -> 142.250.187.110 ICMP TTL:64 TOS:0x0 ID:44765 IpLen:20 DgmLen:84 DF Type:8 Code:0 ID:1 Seq:72 ECHO =============================================================================== Packet I/O Totals: ` Received: 51 ` ` Analyzed: 51 (100.000%) ` ` Dropped: 0 ( 0.000%) ` ` Filtered: 0 ( 0.000%) ` Outstanding: 0 ( 0.000%) ` Injected: 0 ` =============================================================================== Breakdown by protocol (includes rebuilt packets): ... ` Total: 51 ` =============================================================================== Snort exiting
Note that Snort can read and handle the binary like output (tcpdump and Wireshark also can handle this log format). However, if you create logs with “-K ASCII” parameter, Snort will not read them. As you can see in the above output, Snort read and displayed the log file just like in the sniffer mode.
Opening log file with tcpdump.
Opening the log file with tcpdump
user@ubuntu$ sudo tcpdump -r snort.log.1638459842 -ntc 10
reading from file snort.log.1638459842, link-type EN10MB (Ethernet) IP 192.168.175.129 > 142.250.187.110: ICMP echo request, id 1, seq 49, length 64 IP 142.250.187.110 > 192.168.175.129: ICMP echo reply, id 1, seq 49, length 64 IP 192.168.175.129 > 142.250.187.110: ICMP echo request, id 1, seq 50, length 64 IP 142.250.187.110 > 192.168.175.129: ICMP echo reply, id 1, seq 50, length 64 IP 192.168.175.129 > 142.250.187.110: ICMP echo request, id 1, seq 51, length 64 IP 142.250.187.110 > 192.168.175.129: ICMP echo reply, id 1, seq 51, length 64 IP 192.168.175.129 > 142.250.187.110: ICMP echo request, id 1, seq 52, length 64 IP 142.250.187.110 > 192.168.175.129: ICMP echo reply, id 1, seq 52, length 64 IP 192.168.175.1.63096 > 239.255.255.250.1900: UDP, length 173 IP 192.168.175.129 > 142.250.187.110: ICMP echo request, id 1, seq 53, length 64
Opening log file with Wireshark.
“-r” parameter also allows users to filter the binary log files. You can filter the processed log to see specific packets with the “-r” parameter and Berkeley Packet Filters (BPF).
sudo snort -r logname.log -Xsudo snort -r logname.log icmpsudo snort -r logname.log tcpsudo snort -r logname.log 'udp and port 53'
The output will be the same as the above, but only packets with the chosen protocol will be shown. Additionally, you can specify the number of processes with the parameter “-n”. The following command will process only the first 10 packets:
snort -dvr logname.log -n 10
Please use the following resources to understand how the BPF works and its use.
- https://en.wikipedia.org/wiki/Berkeley_Packet_Filter
- https://biot.com/capstats/bpf.html
- https://www.tcpdump.org/manpages/tcpdump.1.html
Now, use the attached VM and navigate to the Task-Exercises/Exercise-Files/TASK-6 folder to answer the questions!
Answer the questions below
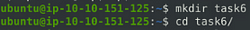
So I created a new file to help keep everything contained. To do this use the command mkdir task6, this will create a new directory. Then move over to the task6 directory with cd task6/ .
Investigate the traffic with the default configuration file with ASCII mode.
sudo snort -dev -K ASCII -l .
In the terminal you are using for snort, type out the command but don’t press enter to run it just yet.

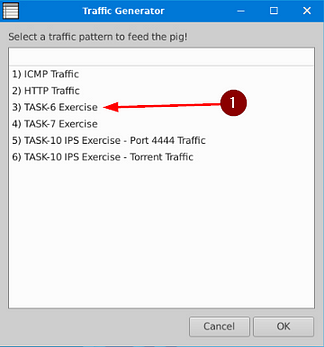
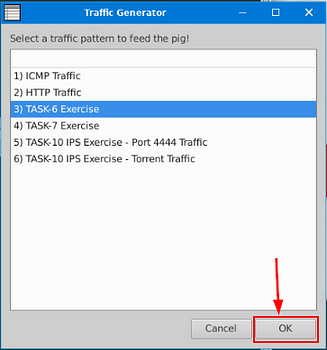
Execute the traffic generator script and choose “TASK-6 Exercise”. Wait until the traffic ends, then stop the Snort instance. Now analyse the output summary and answer the question.
sudo ./traffic-generator.sh
In another terminal that you’ve been running the traffic-generator, type out the command above and press enter to run it.

A window will pop-up, you want to click on the TASK-6 Exercise.
Go back to your, and press enter to run Snort.
While Snort is running, go back to the Traffic generator and click the OK button in the bottom right.
Once the Traffic Generator is done running, press ctrl c to stop Snort. Once stop you are ready to start answering the question.
Now, you should have the logs in the current directory. Navigate to folder “145.254.160.237”. What is the source port used to connect port 53?
Before we change move into the directory we have to change into a superuser, to do this use the command sudo su .

Change directory with cd 145.254.160.237/ .

Now that we are in the directory let’s look to see what is in this directory with ls .

We can see inside the directory that we have three logs, one of which deals with port 53. Once you find it, type the answer into the TryHackMe Answer field, then click submit.

Answer: 3009
Use snort.log.1640048004
Go head back to the terminal that you were doing the Traffic Generator in. Running ls through the directories we can see where the snort.log.1640048004 is located.
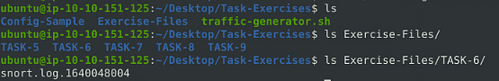
Now it is time to change directories over to the directory that holds the log file with cd Exercise-Files/TASK-6/ .

Now you are ready to start running the next commands, and answering the next questions.
Read the snort.log file with Snort; what is the IP ID of the 10th packet?
snort -r snort.log.1640048004 -n 10
Run the command above execpt we need to add sudo, sudo snort -r snort.log.1640048004 -n 10 . Press enter to run, and have snort read the log.

Scroll up till you reach the last packet. If you look at the third row of the packet you will see ID:, the number after is the answer. Once you find it, type the answer into the TryHackMe Answer field, then click submit.
Answer: 49313
Read the “snort.log.1640048004” file with Snort; what is the referer of the 4th packet?
Let’s run the command again only this time we are going to add the -X parameter to it to display the details. So the command is sudo snort -r snort.log.1640048004 -X -n 10 .

Scroll down to the 4th output, once there we see a long line of hex. But we can see some readable text on the right, if you look down at the bottom of this readable text you will find Referer:, the answer is right after this. Once you find it, type the answer into the TryHackMe Answer field, then click submit.
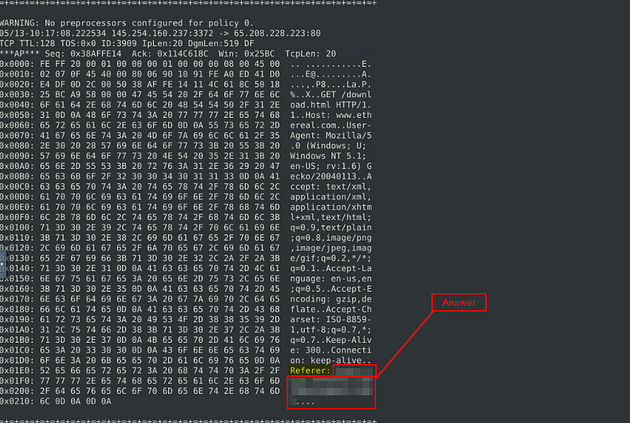
Answer: http://www.ethereal.com/development.html
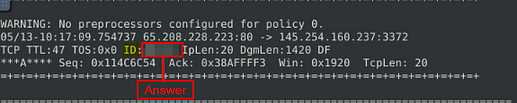
Read the “snort.log.1640048004” file with Snort; what is the Ack number of the 8th packet?
So scroll down till you reach packet 8 or what I did was got to packet 10 and scrolled up till I reached packet 8. But once you are there, look in the 4th row, you will see Ack:, the hex value is the answer. Once you find it, type the answer into the TryHackMe Answer field, then click submit.

Answer: 0x38AFFFF3
Read the “snort.log.1640048004” file with Snort; what is the number of the “TCP port 80” packets?
Time to modify the syntax a bit and run snort again, this time it should be sudo snort -r snort.log.1640048004 'tcp port 80' . Once you have this typed into the terminal press enter to run it.

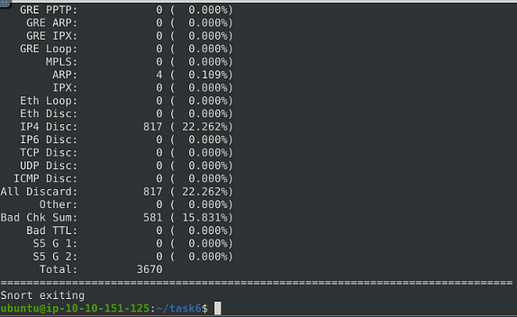
When it is done running, the answer will be at the bottom in the Total row. Once you find it, type the answer into the TryHackMe Answer field, then click submit.
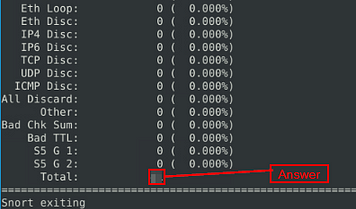
Answer: 41
You have finished these tasks, and can now move onto Task 7 Operation Mode 3: IDS/IPS & Task 8 Operation Mode 4: PCAP Investigation.