If you haven’t done tasks 1 & 2 yet, here is the link to my write-up of them: Task 1 Introduction & Task 2 Tool Overview
Getting The VM Started
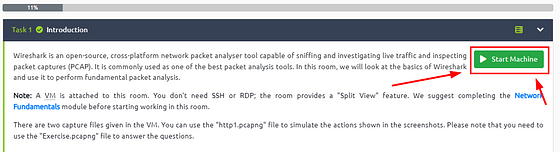
Starting at Task 1, you will see the green Start Machine button. Click this button to get the VM Started.
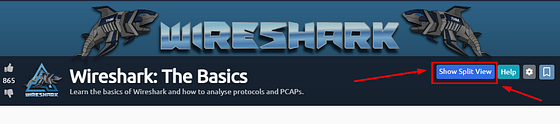
Scroll to the top where the banner is. On the right side of the page, you will see the blue Show Split view. Click this blue button.
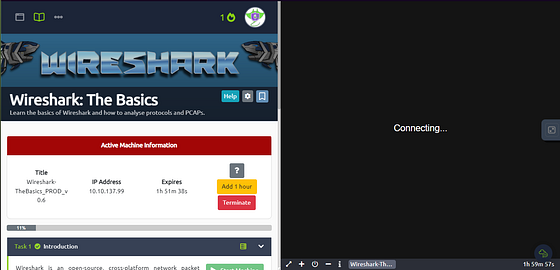
The page will split, now just wait till the VM loads.
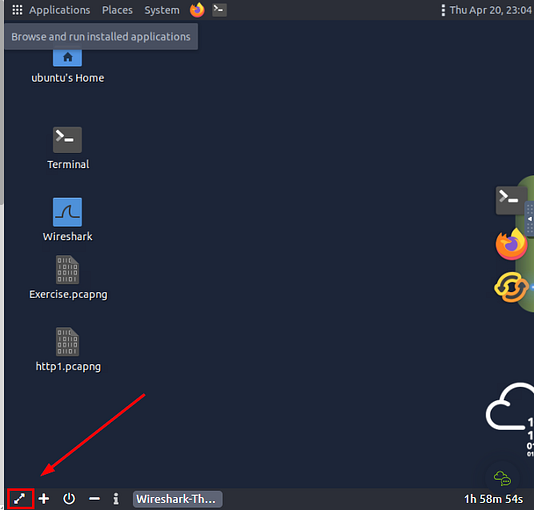
Once the VM loads, click the View in Full Screen icon in the bottom left of the VM.
A new browser tab should open with the VM in it.
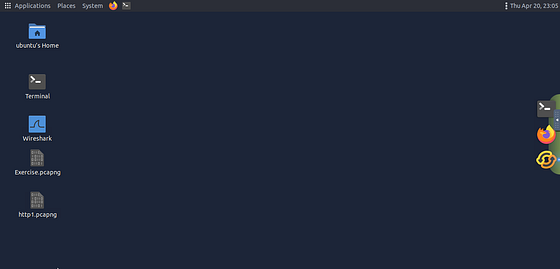
Now depending on what you are doing, if you are following along with the screenshot, use http1.pcapng. If you are answering the questions, use Exercise.pcapng. Whichever you choose, right-click on the file, then on the drop-down menu click the Open With Wireshark.

This will open that file into Wireshark, and you will be ready to go!!
Task 3 Packet Dissection
Packet Dissection
Packet dissection is also known as protocol dissection, which investigates packet details by decoding available protocols and fields. Wireshark supports a long list of protocols for dissection, and you can also write your dissection scripts. You can find more details on dissection here.
Note: This section covers how Wireshark uses OSI layers to break down packets and how to use these layers for analysis. It is expected that you already have background knowledge of the OSI model and how it works.
Packet Details
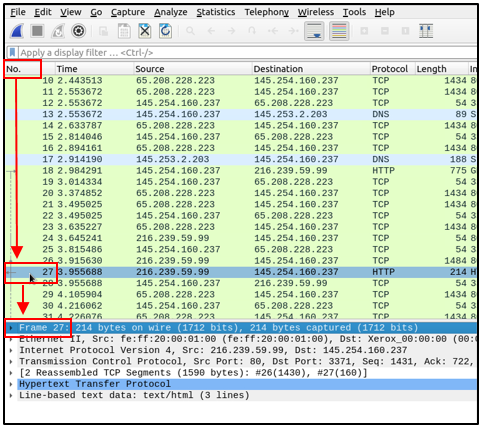
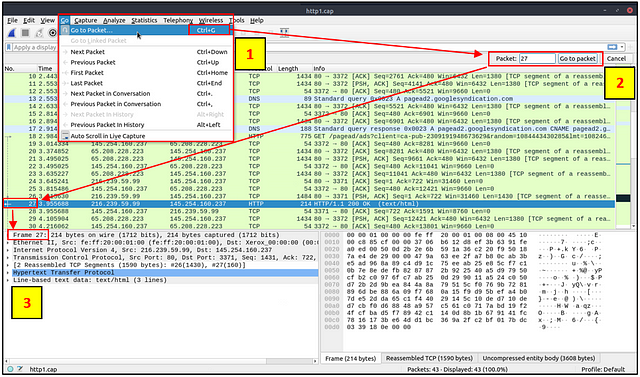
You can click on a packet in the packet list pane to open its details (double-click will open details in a new window). Packets consist of 5 to 7 layers based on the OSI model. We will go over all of them in an HTTP packet from a sample capture. The picture below shows viewing packet number 27.
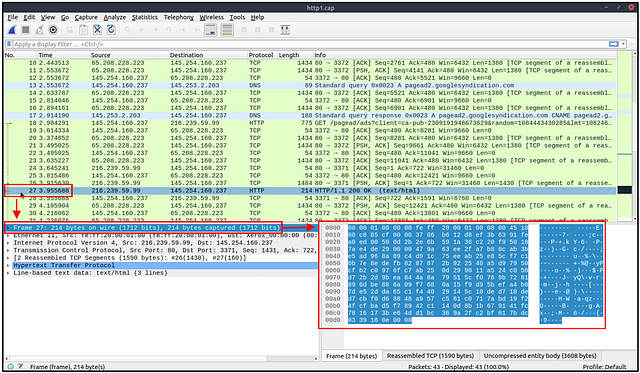
Each time you click a detail, it will highlight the corresponding part in the packet bytes pane.

Let’s have a closer view of the details pane.
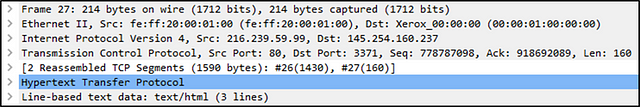
We can see seven distinct layers to the packet: frame/packet, source [MAC], source [IP], protocol, protocol errors, application protocol, and application data. Below we will go over the layers in more detail.
The Frame (Layer 1): This will show you what frame/packet you are looking at and details specific to the Physical layer of the OSI model.

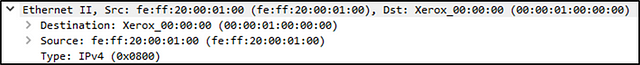
Source [MAC] (Layer 2): This will show you the source and destination MAC Addresses; from the Data Link layer of the OSI model.
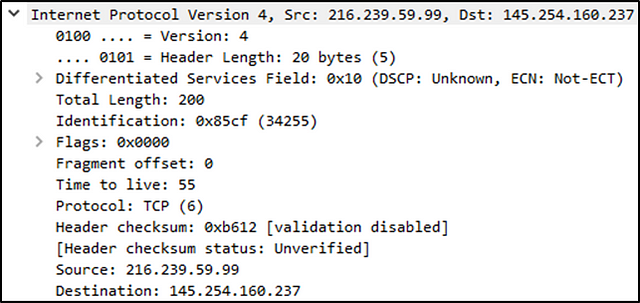
Source [IP] (Layer 3): This will show you the source and destination IPv4 Addresses; from the Network layer of the OSI model.
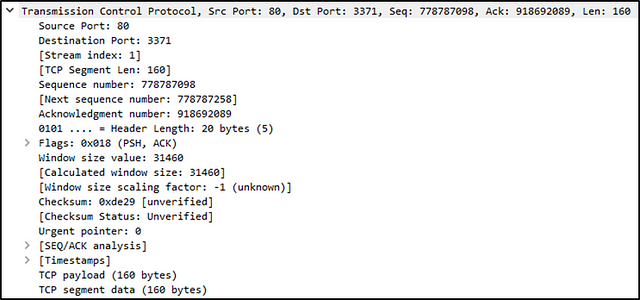
Protocol (Layer 4): This will show you details of the protocol used (UDP/TCP) and source and destination ports; from the Transport layer of the OSI model.
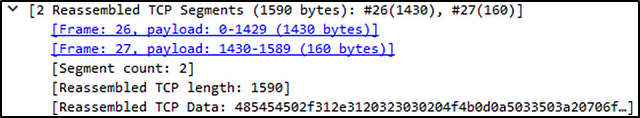
Protocol Errors: This continuation of the 4th layer shows specific segments from TCP that needed to be reassembled.
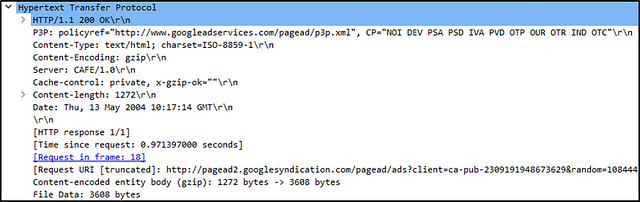
Application Protocol (Layer 5): This will show details specific to the protocol used, such as HTTP, FTP, and SMB. From the Application layer of the OSI model.
Application Data: This extension of the 5th layer can show the application-specific data.
Now that we understand what a general packet is composed of, let’s look at various application protocols and their specific details.
Answer the questions below
Use the “Exercise.pcapng” file to answer the questions.
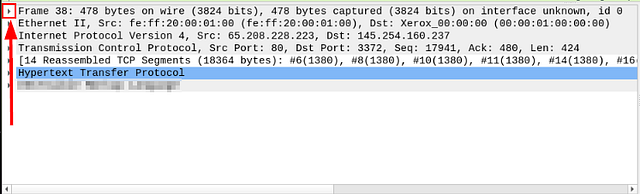
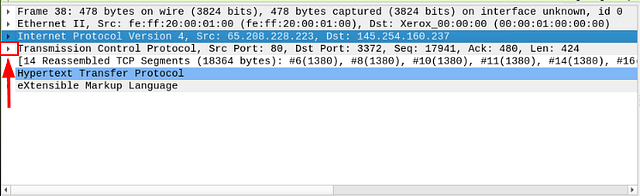
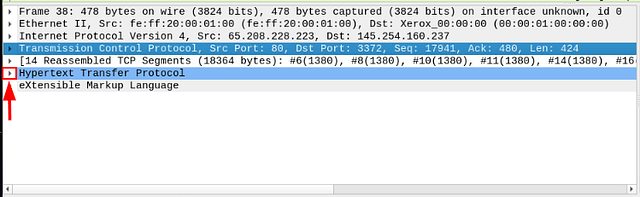
View packet number 38. Which markup language is used under the HTTP protocol?
Once the file has opened in Wireshark, look at the Menu Bar at the top of the Window. Click on Go, a drop down menu will appear. Click on Go To Packet…

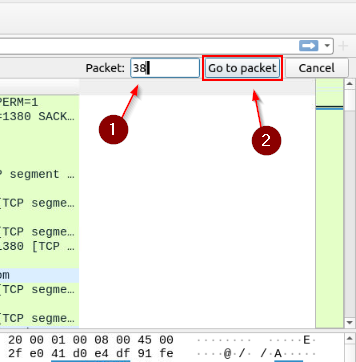
On the right side of the window, the Packet search Bar will appear. Type 38 into the field, and press enter or click the Got To Packet button.
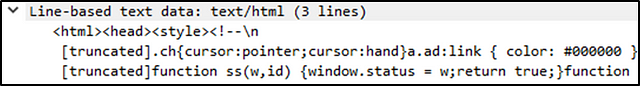
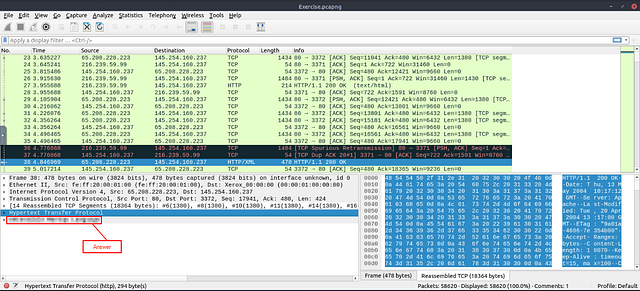
You will be brought right to directly to the packet. You should be able to see the answer sitting right under the Hypertext Transfer Protocol section. You can type the answer into the answer section or Copy and Paste the answer (under this screen shot, I will show how to copy the correct field).
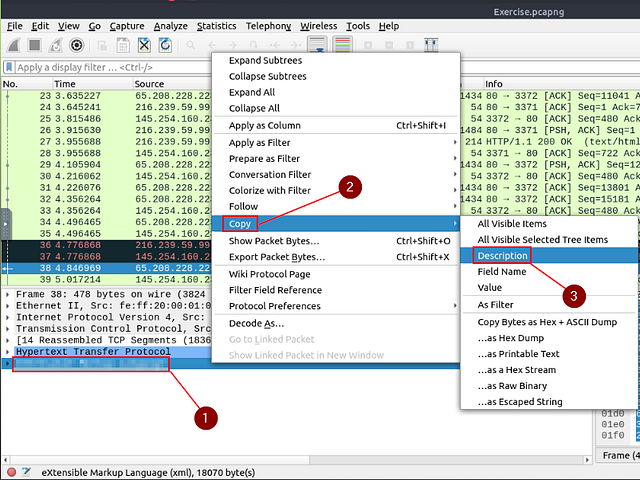
Right-click on the answer. From the drop-down menu, hover over copy. A new drop-down will appear, click on Description. You now have the answer copied on your clipboard. Click on the answer section of THM, paste it via CTRL + V, and click submit.
Answer: eXtensible Markup Language
What is the arrival date of the packet? (Answer format: Month/Day/Year)
We learned about this from the section The Frame (Layer 1) above. Clicking on the first sections drop-down icon, it will open the details of said section.
With this layers details being displayed, look down till you see Arrival Time. You will see the answer right after the colon. The format is two digits for the month, two digits for the day, and four digits for the month (00/00/0000). Type this answer into the THM answer field, and click submit.
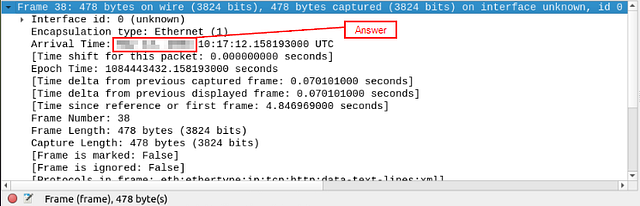
Answer: 05/13/2004
What is the TTL value?
Now you want to move down to the IP Layer (Internet Protocol Version 4), and click the drop-down icon to view this layers details.

In the details, look for Time to live:, the answer will be found here. Once you find it, type the answer into the THM answer field, and click submit.
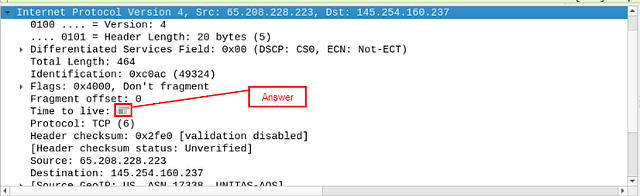
Answer: 47
What is the TCP payload size?
Move down one more layer to the Protocol Layer (Transmission Control Protocol), and click the drop-down icon.
In the details, look for TCP Segment Len:, the answer will be found here. Additionally, the answer can be found in the layer overview at the end after Len: . Once you find it, type the answer into the THM answer field, and click submit.
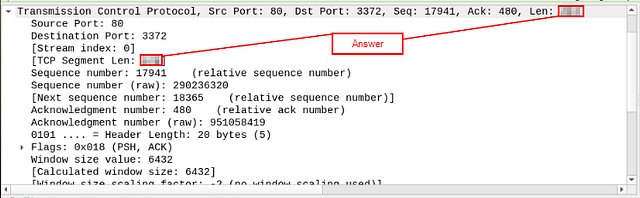
Answer: 424
What is the e-tag value?
Move down two more layers to the Application Layer (Hypertext Transfer Protocol), and click the drop-down icon.
In the details, look for ETag:, the answer will be found here. Click on it and using copy (CTRL+ C). Go over to the THM answer field and use paste ( CTRL+V). Now just delete the extra data (ETag: “ “\r\n) that was copied over. It should leave only the answer left, now just click submit.
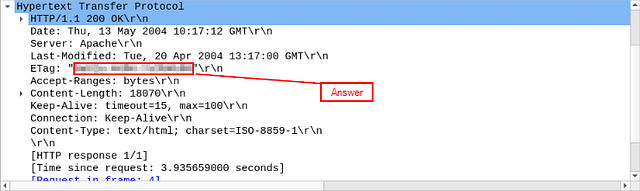
Answer: 9a01a-4696–7e354b00
Task 4 Packet Navigation
Packet Numbers
Wireshark calculates the number of investigated packets and assigns a unique number for each packet. This helps the analysis process for big captures and makes it easy to go back to a specific point of an event.
Go to Packet
Packet numbers do not only help to count the total number of packets or make it easier to find/investigate specific packets. This feature not only navigates between packets up and down; it also provides in-frame packet tracking and finds the next packet in the particular part of the conversation. You can use the “Go” menu and toolbar to view specific packets.
Find Packets
Apart from packet number, Wireshark can find packets by packet content. You can use the “Edit → Find Packet” menu to make a search inside the packets for a particular event of interest. This helps analysts and administrators to find specific intrusion patterns or failure traces.
There are two crucial points in finding packets. The first is knowing the input type. This functionality accepts four types of inputs (Display filter, Hex, String and Regex). String and regex searches are the most commonly used search types. Searches are case insensitive, but you can set the case sensitivity in your search by clicking the radio button.
The second point is choosing the search field. You can conduct searches in the three panes (packet list, packet details, and packet bytes), and it is important to know the available information in each pane to find the event of interest. For example, if you try to find the information available in the packet details pane and conduct the search in the packet list pane, Wireshark won’t find it even if it exists.
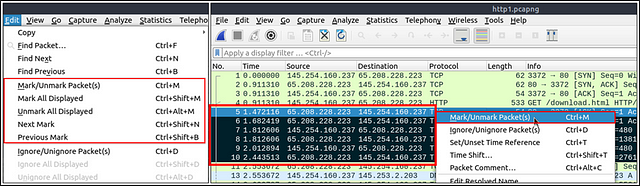
Mark Packets
Marking packets is another helpful functionality for analysts. You can find/point to a specific packet for further investigation by marking it. It helps analysts point to an event of interest or export particular packets from the capture. You can use the “Edit” or the “right-click” menu to mark/unmark packets.
Marked packets will be shown in black regardless of the original colour representing the connection type. Note that marked packet information is renewed every file session, so marked packets will be lost after closing the capture file.
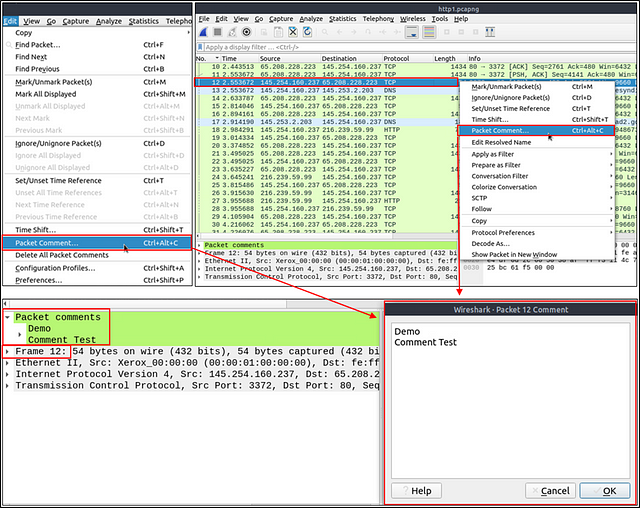
Packet Comments
Similar to packet marking, commenting is another helpful feature for analysts. You can add comments for particular packets that will help the further investigation or remind and point out important/suspicious points for other layer analysts. Unlike packet marking, the comments can stay within the capture file until the operator removes them.
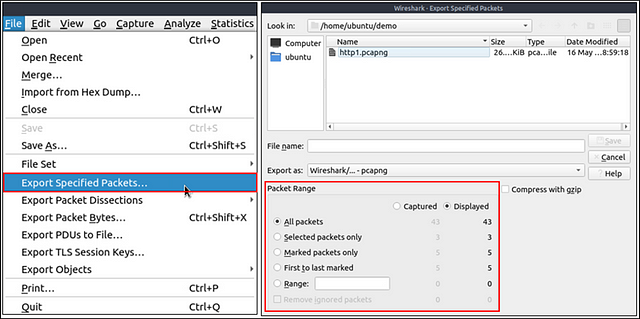
Export Packets
Capture files can contain thousands of packets in a single file. As mentioned earlier, Wireshark is not an IDS, so sometimes, it is necessary to separate specific packages from the file and dig deeper to resolve an incident. This functionality helps analysts share the only suspicious packages (decided scope). Thus redundant information is not included in the analysis process. You can use the “File” menu to export packets.
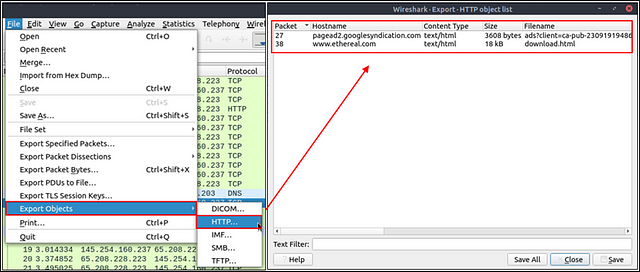
Export Objects (Files)
Wireshark can extract files transferred through the wire. For a security analyst, it is vital to discover shared files and save them for further investigation. Exporting objects are available only for selected protocol’s streams (DICOM, HTTP, IMF, SMB and TFTP).
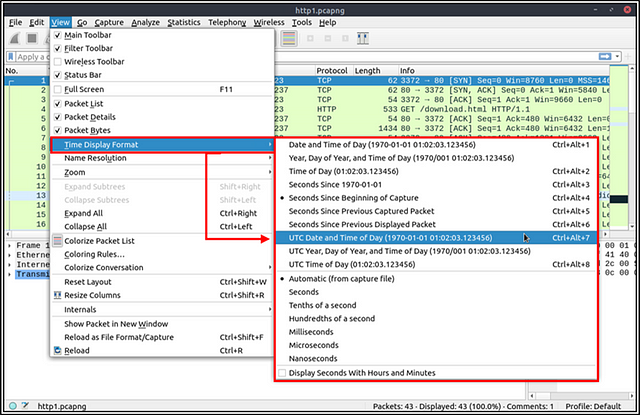
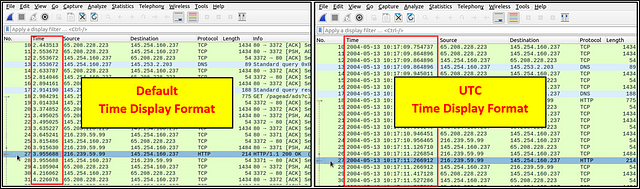
Time Display Format
Wireshark lists the packets as they are captured, so investigating the default flow is not always the best option. By default, Wireshark shows the time in “Seconds Since Beginning of Capture”, the common usage is using the UTC Time Display Format for a better view. You can use the “View → Time Display Format” menu to change the time display format.
Expert Info
Wireshark also detects specific states of protocols to help analysts easily spot possible anomalies and problems. Note that these are only suggestions, and there is always a chance of having false positives/negatives. Expert info can provide a group of categories in three different severities. Details are shown in the table below.
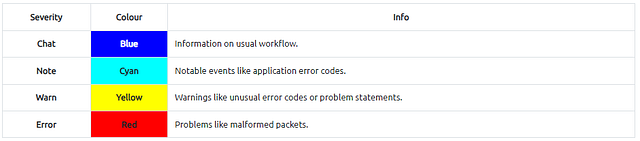
Frequently encountered information groups are listed in the table below. You can refer to Wireshark’s official documentation for more information on the expert information entries.

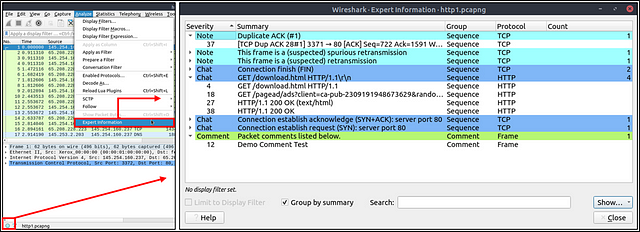
You can use the “lower left bottom section” in the status bar or “Analyse → Expert Information” menu to view all available information entries via a dialogue box. It will show the packet number, summary, group protocol and total occurrence.
Answer the questions below
Use the “Exercise.pcapng” file to answer the questions.
Search the “r4w” string in packet details. What is the name of artist 1?
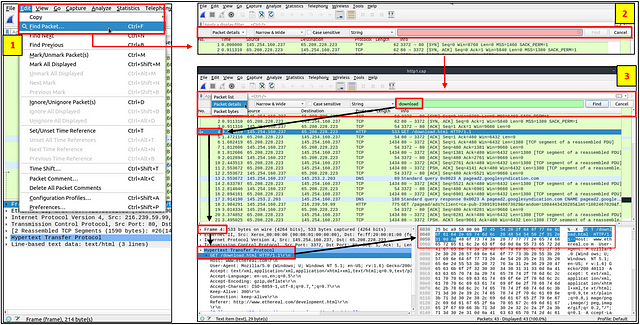
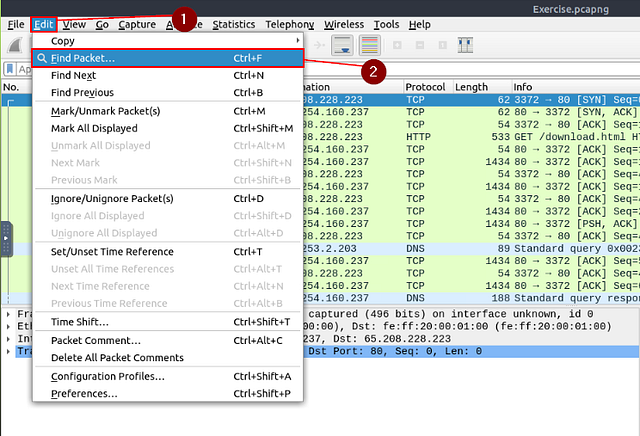
Start by clicking Edit from the Menu Bar at the top of the window. From the drop-down menu click Find Packet….
A new section will appear under the Filter bar. This is the Find Packet search bar. It should already be set up to be looking for strings, which you can see in the drop-down next to the search bar. Type in the green search bar r4w, and either press enter or click the Find button.

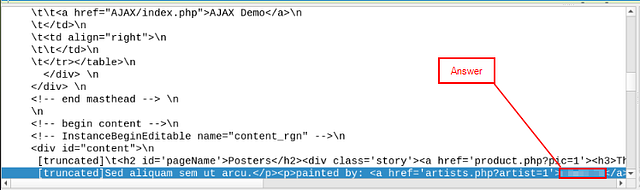
Give Wireshark a moment to find the string amoungst the Packet. Once it does, you should be able to see it in the Packet Detail section, highlighted in blue. As you can see we have HTML, reading over the line it states painted by followed by the text <a href=’artists.php?artist=1’>. This is how you declaire a link in HTML, and the text that follows is the link text that the user will see. Looking at the link text we can see that it is associated with artist 1. So knowing this along with how HTML links are declaired, you can find the answer directly after the aforementioned text. Once you find it, type the answer into the THM answer field, then click submit.
Answer: r4w8173
Go to packet 12 and read the comments. What is the answer?
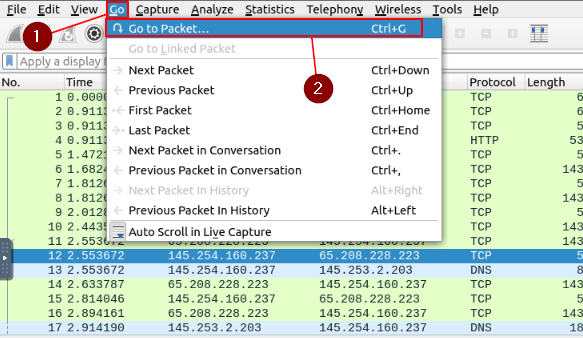
Go back up to the top of the window and click the Go tab from the Menu Bar. Then from the drop-down click the Go to Packet…. option.
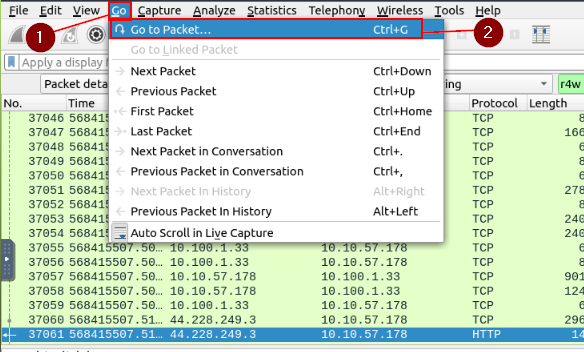
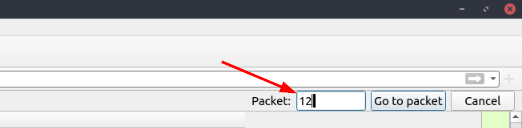
On the right side of the window, the Packet search Bar will appear. Type 12 into the field, and either press enter or click the Got To Packet button.
You will then be brought to Packet 12. At the top of the Packet Details section you can see Packet comments. You could click on it so see the comments, but they are not easily readable. So we will go with the other option of viewing Packet Comments. To do this, click the Edit tab from the Menu bar at the top of the window. From the drop-down menu, click the Packet Comment… option.

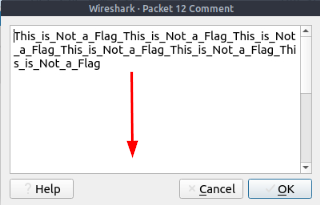
A pop up window will appear with the Packet Comments inside. As you can see This_is_Not_a_Flag, is written over and over again. But there is more, so scroll down to get more directions.
Once you reach the bottom, you are greated with the next steps of how to complete this question. I ended up copying (CTRL+C) and pasting (CTRL+V) the detailed steps here in notepad so I could reference them later. But feel free to just use the screen show I have below to instead.

First we need to go to Packet 39765, to do this we will use the same process that we did to find Packet 12. Go back up to the top of the window and click the Go tab from the Menu Bar. Then from the drop-down click the Go to Packet…. option.
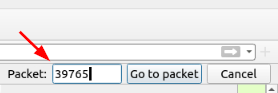
On the right side of the window, the Packet search Bar will appear. Type 39765 into the field, and either press enter or click the Got To Packet button.
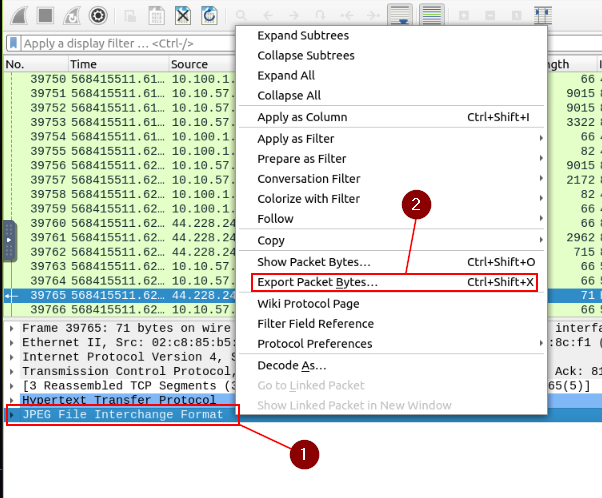
The next steps stated Look at the “packet details pane”. Right-click on the JPEG section and “Export packet bytes”. Looking at the Packet Detail area, the last section is JPEG File Interchange Format. Right-click on this section, then click Export Packet Bytes… from the drop-down menu.
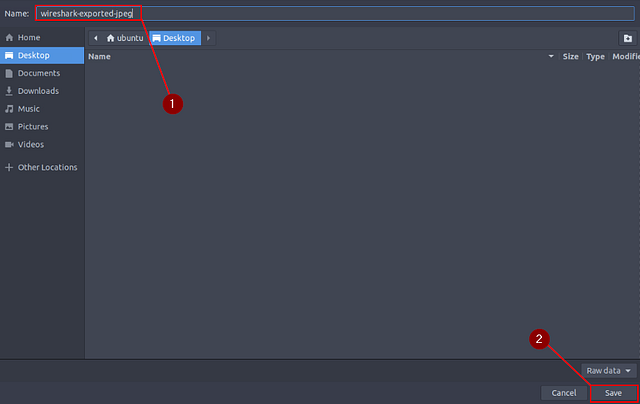
A window will pop-up so that you can save/export the Packet Bytes. You can add what ever name you would like to this, but I like to make mine discriptive. So I named mine wireshark-exported-jpeg. After you have named the file, click the Save button in the bottom right.
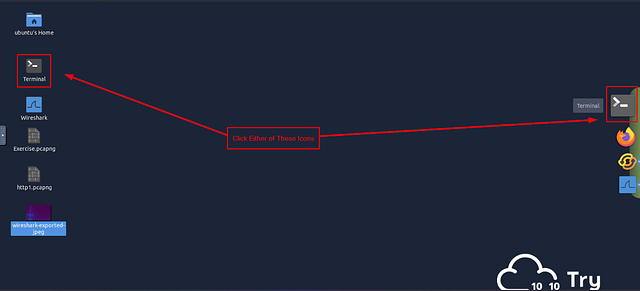
Now use the Minimize button in the top right of the window, to minimize Wireshark.

On the Desktop, click one of the two Terminal icons to open a terminal instance.
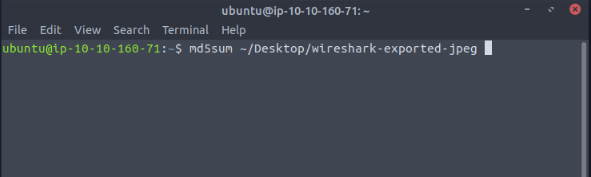
When the terminal window appears, type the following command md5sum ~/Desktop/{Name of the file you just extracted}. So in my case the command was md5sum ~/Desktop/wireshark-exported-jpeg. Then press enter to run the command.
After you have press enter and ran the command, you will see the md5 hash of the image file along with the path to the file. Highlight and copy (CTRL+SHIFT+C) the hash portion from the terminal. Then paste (CTRL+V) the hash into the THM answer field, and click submit.
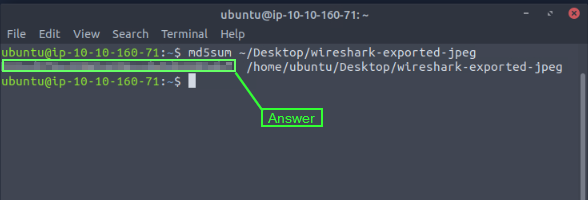
Answer: 911cd574a42865a956ccde2d04495ebf
There is a “.txt” file inside the capture file. Find the file and read it; what is the alien’s name?
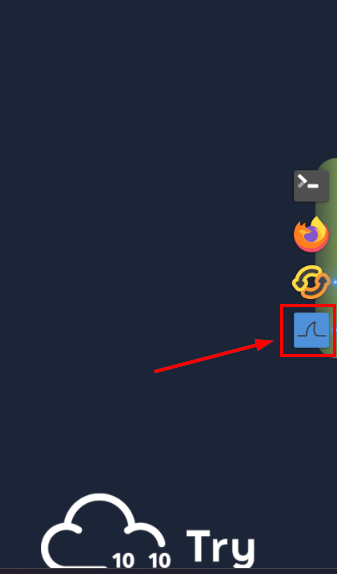
Click the Wireshark icon on the left side of the screen to bring Wireshark back up.
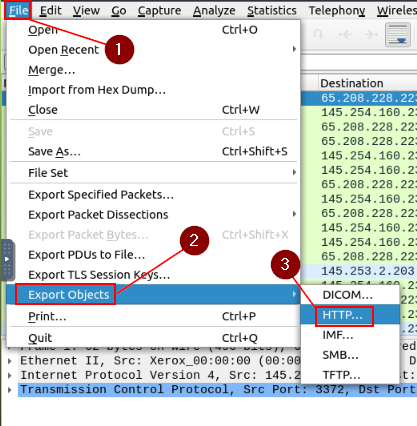
This time we are goin to start by clicking the File tab from the Menu Bar. From the drop-down, hover your cursor over the Export Objects option. Another drop-down menu will appear, on this one click the HTTP… option.
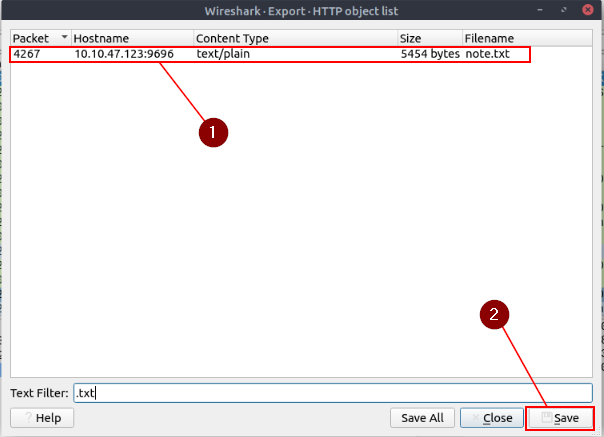
A new window will pop-up for the Export — HTTP object list. At the bottom of the window is a Text Filter: field, type .txt into this field.
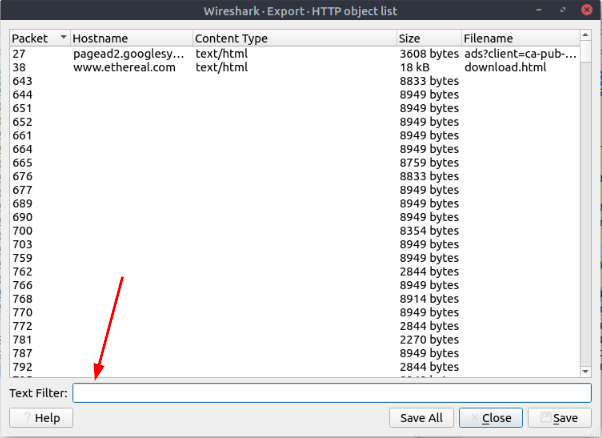
It should automatically filter out everything except what matches the filter. You should only have one result, click on the packet and then click the Save button.
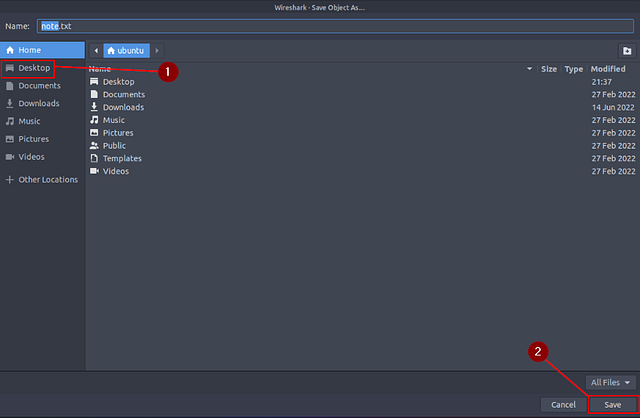
The Save Object As… pop-up window will appear. First click Desktop from the quick menu on the left side of the window. From there click the Save button at the bottom right.
Now use the Minimize button in the top right of the window, to minimize Wireshark.
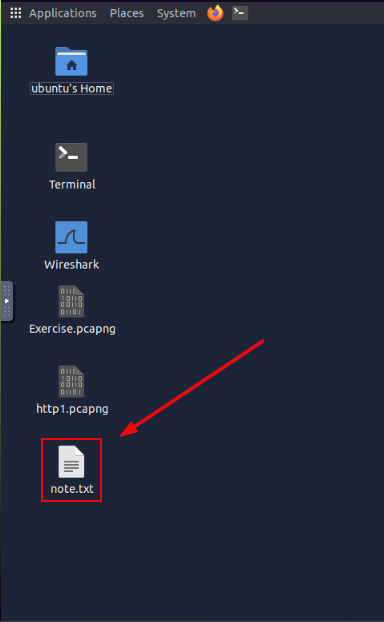
On the Desktop you will now see the note.txt file. Double-click the file to open it.
When the file opens you are greeted by this lovely ASCII art Alien head. Scroll down to find out the Aliens name.

Once you scroll down far enough you will see the Aliens name in giant ASCII art letters. Type what you find into the THM answer field, and click submit.
Answer: Packetmaster
Look at the expert info section. What is the number of warnings?
Click the Wireshark icon on the left side of the screen to bring Wireshark back up.
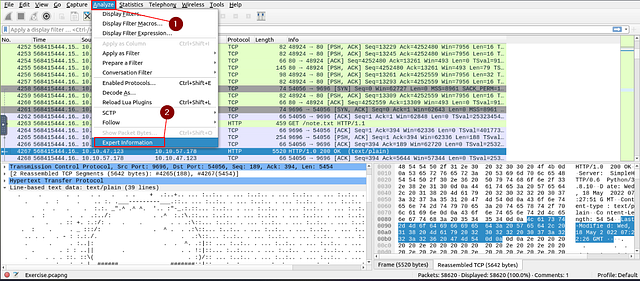
Finally for this task, click on the Analyze tab from the Menu bar. In the drop-down click on Expert Information.
The Expert Information window will pop-up. Look for the color yellow or the severity of Warning. Once you find it, follow the row all the way to the right. You will see the number of _Warning_s, and thus the answer to this question. Type the answer into the THM answer field, and click submit.
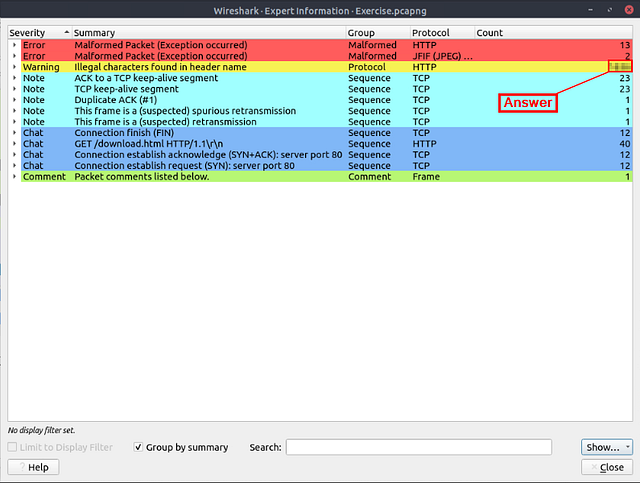
Answer: 1636
You have finished these tasks and can now move on to Task 5 Packet Filtering & Task 6 Conclusion