This is a premium room on TryHackMe. It was created by TryHackMe & Dex01. Here it the link to said room, TryHackMe Logstash: Data Processing Unit Room.
Learn how to collect, process and transform data with Logstash.

Task 1 Introduction
Logstash is an open-source data processing engine that allows you to collect, enrich, and transform data from different sources. It is often used alongside other tools in the Elastic Stack, such as Elasticsearch and Kibana, to create a complete data processing and visualization pipeline. In this room, we will explore Logstash in-depth and how data from different sources can be ingested, parsed, normalized, and sent to various choice outputs.
Learning Objective
Some of the learning objectives this room will cover are:
- Overview of ELK stack
- Installing and configuring ELK stack
- Explore various Input, filter, and output plugins for Logstash
- How to use Grok plugin to parse and normalize unstructured data
Prerequisite
As this room is primarily focused on Logstash and only talks about the other two components briefly, its good to have explored the following rooms before starting:
Task 2 Connecting with the Lab
Room Machine
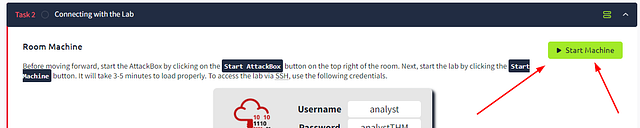
Before moving forward, start the AttackBox by clicking on the Start AttackBox button on the top right of the room. Next, start the lab by clicking the Start Machine button. It will take 3-5 minutes to load properly.
After a couple of minutes. You will see that IP address for the target machine at the top of the page and where the credentials are shared.
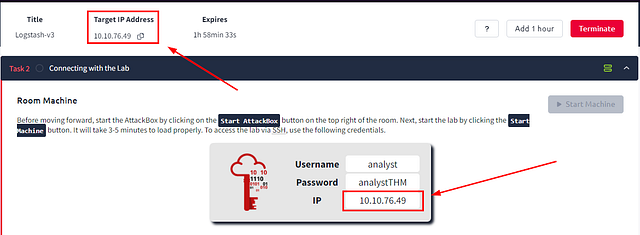
To access the lab via SSH, use the following credentials.

Username: analyst
Password: analystTHM
IP: $MACHINE_IP
We will install Elasticsearch, Logstash, and Kibana in this room and configure them to work together. All important files are placed in /home/tools/ directory. Once all three components are installed, the Kibana interface will be accessible over MACHINE_IP:5601.
Connecting To The Lab
You will have a couple of ways to connect to the lab. As it is stated above, you can start an AttackBox and connect that way. Since I have OpenVPN set up. I will be using that and SSHing via machine own machine. If you need to set up OpenVPN, here is the page on TryHackMe.
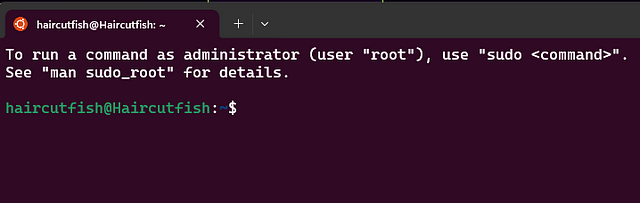
In Windows, open a terminal. You can do this easily by pressing the windows key and typing terminal. Mine is set up to open in Ubuntu with WSL2, which is why it looks the way it does:
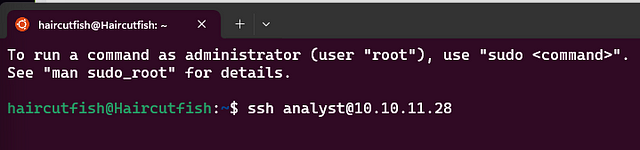
Time to SSH in! You can easily do this with the following command ssh analyst@$MACHINE_IP. Then press enter to begin.
You will be asked Are you sure you want to continue connecting (yes/no/[fingerpring])? . Type yes and press enter
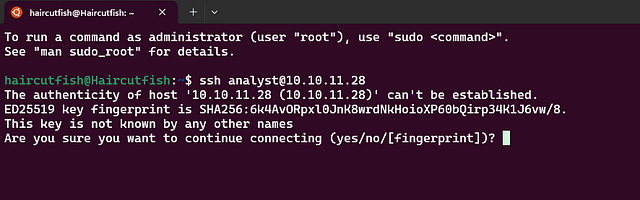
It is now asking for the password. This is the one that THM has given us above. Either copy and paste or type the password and press enter.

If you entered it correctly. You will be greated with a way of text. Then finally, CLI (Command Line Interface).
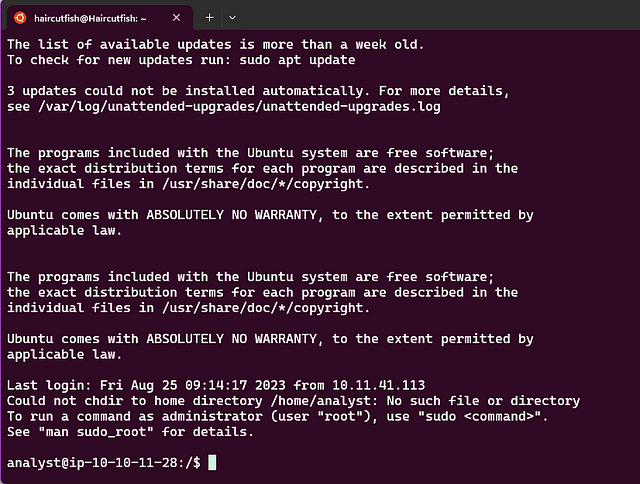
You are now connected and ready to move onto Task 3!!!
Task 3 Elasticsearch: Installation and Configuration
Elasticsearch
Elasticsearch is a distributed, open-source search and analytics engine that allows you to store, search, and analyze large volumes of data in real-time. It is built on top of Apache Lucene and provides a scalable solution for full-text search, structured querying, and data analysis.

In this room, we will use Elasticsearch to store data after being filtered/normalized by Logstash. It’s important to know how to install and configure Elasticsearch.
Installing Elasticsearch
Let’s go through the process of installing Elasticsearch. The latest installation instance is placed on the path /home/tools/elasticsearch.
analyst@tryhackme:/home/tools/elasticsearch# ls
elasticsearch.deb
Run the following command dpkg -i elasticsearch.deb as a root user to install Elasticsearch on the lab. It will take 1-2 minutes to get installed, as shown below:
Note: Make sure to change the user to root using the command sudo su
1
2
3
4
5
6
7
8
9
10
11
12
13
14
15
16
17
root@tryhackme:/home/tools/elasticsearch# dpkg -i elasticsearch.deb
Selecting previously unselected package elasticsearch.
(Reading database ... 319953 files and directories currently installed.)
Preparing to unpack elasticsearch.deb ...
Creating elasticsearch group... OK
Creating elasticsearch user... OK
Unpacking elasticsearch (8.8.0) ...
Setting up elasticsearch (8.8.0) ...
.................
Security autoconfiguration information...
.................
.................
NOT starting on installation, please execute the following statements to configure elasticsearch service to start automatically using systemd
 sudo systemctl daemon-reload
 sudo systemctl enable elasticsearch.service
### You can start elasticsearch service by executing
 sudo systemctl start elasticsearch.service
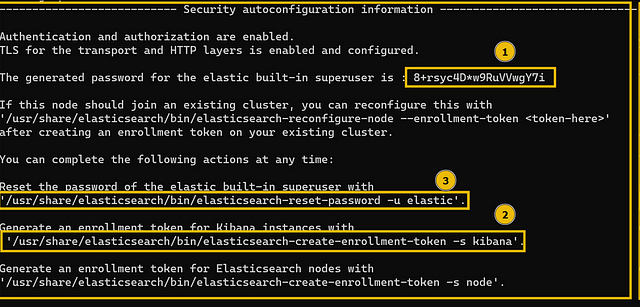
When installing for the first time, security configuration will be displayed, including the default password for the elastic user; note this down as it will be used later.
If all goes well, Elasticsearch will be installed on the host.
The following commands will be used to make the Elasticsearch service persistent so that it gets started whenever the server restarts.
1
2
3
root@tryhackme:/home/tools/elasticsearch# systemctl enable elasticsearch.service
Created symlink /etc/systemd/system/multi-user.target.wants/elasticsearch.service → /lib/systemd/system/elasticsearch.service.
root@tryhackme:/home/tools/elasticsearch# systemctl start elasticsearch.service
Elasticsearch Status
Now that we have installed Elasticsearch successfully, let’s check its status to see if it’s installed and running properly.
1
2
3
4
5
6
7
8
9
10
11
12
13
14
root@tryhackme:/home/tools/elasticsearch# systemctl status elasticsearch.service
● elasticsearch.service - Elasticsearch
     Loaded: loaded (/lib/systemd/system/elasticsearch.service; enabled; vendor preset: enabled)
     Active: active (running) since Wed 2023-06-07 05:51:33 UTC; 4min 33s ago
       Docs: https://www.elastic.co
   Main PID: 3389 (java)
      Tasks: 69 (limit: 4710)
     Memory: 2.3G
     CGroup: /system.slice/elasticsearch.service
             ├─3389 /usr/share/elasticsearch/jdk/bin/java -Xms4m -Xmx64m -XX:+UseSerialGC -Dcli.name=server -Dcli.script=/usr/share/elastic>
             ├─3465 /usr/share/elasticsearch/jdk/bin/java -Des.networkaddress.cache.ttl=60 -Des.networkaddress.cache.negative.ttl=10 -Djava>
             └─3485 /usr/share/elasticsearch/modules/x-pack-ml/platform/linux-x86_64/bin/controller
Jun 07 05:51:10 tryhackme systemd[1]: Starting Elasticsearch...
Jun 07 05:51:33 tryhackme systemd[1]: Started Elasticsearch.
This output shows the elasticsearch service has been successfully installed and running properly.
Configuring Elasticsearch
We have successfully installed Elasticsearch on the Linux host. We will now make some changes to the configuration so that it’s accessible to other components as well.
Important Configurations
All important configuration files related to Elasticsearch can be found in the /etc/elasticsearch directory.
1
2
3
4
root@tryhackme:/home/tools/elasticsearch#cd /etc/elasticsearch/
root@tryhackme:/etc/elasticsearch# ls
certs                              elasticsearch.keystore  jvm.options    log4j2.properties  roles.yml  users_roles
elasticsearch-plugins.example.yml  elasticsearch.yml       jvm.options.d  role_mapping.yml   users
Go to this directory and explore the files and directories. These are important configuration files; some of them are explained below:
elasticsearch.yml: This is the main configuration file for Elasticsearch. It contains various settings that determine the behavior of Elasticsearch, such as network configuration, cluster settings, node settings, and paths for data storage and logging. Modifying this file allows you to customize Elasticsearch according to your specific requirements.jvm.options: Thejvm.optionsfile contains JVM (Java Virtual Machine) configuration settings for Elasticsearch. It allows you to specify parameters related to memory allocation, garbage collection, and other JVM options. Adjusting these settings is crucial for optimizing Elasticsearch’s performance and ensuring efficient memory usage.log4j2.properties: Thelog4j2.propertiesfile is the configuration file for Elasticsearch’s logging system, Log4j. It defines how Elasticsearch logs different types of messages and sets log levels for different components. You can modify this file to configure the log output format, log rotation, and other logging-related settings.users: Theusersfile is used for configuring user authentication and authorization in Elasticsearch. It allows you to define users, roles, and their respective permissions. By managing this file, you can control access to Elasticsearch resources and secure your cluster.roles.ymlandroles_mapping.yml: These files are used in conjunction with theusersfile to define roles and their mappings to users and privileges. Roles provide a way to group users and assign common permissions to them. Theroles.ymlfile defines the roles and their privileges, while theroles_mapping.ymlfile maps roles to users.
Let’s open the elasticsearch.yml using the command nano elasticsearch.yml and go to the Network section, as shown below:
1
2
3
4
5
6
# ----------------------------------------------------- Network -------------------------------------------------------#
# By default Elasticsearch is only accessible on localhost. Set a different
# address here to expose this node on the network:  network.host: 127.0.0.1
# By default Elasticsearch listens for HTTP traffic on the first free port it
# finds starting at 9200. Set a specific HTTP port here:  http.port: 9200
# For more information, consult the network module documentation.#
In this section, we see the two variables network.host and http.port. Uncomment these two and change the value of the network.host variable to 127.0.0.1 . As we are installing all these components on the same host, therefore we will update the network.host to 127.0.0.1. Once these changes are made, save the document and restart the Elasticsearch service using the following command.
1
root@tryhackme:/home/tools/elasticsearch#systemctl restart elasticsearch.service
Now that we have installed and configured Elasticsearch properly, let’s move on to the next task and install the Logstash component.
Answer the questions below
What is the default port Elasticsearch runs on?
The answer to this question can be found in the elasticsearch.yml. Open it with your favorite text editor. I am using vim.

Once inside, search for http.port. Elasticsearch will have the default port already in this field. Type the answer into the THM answer field and click Submit.
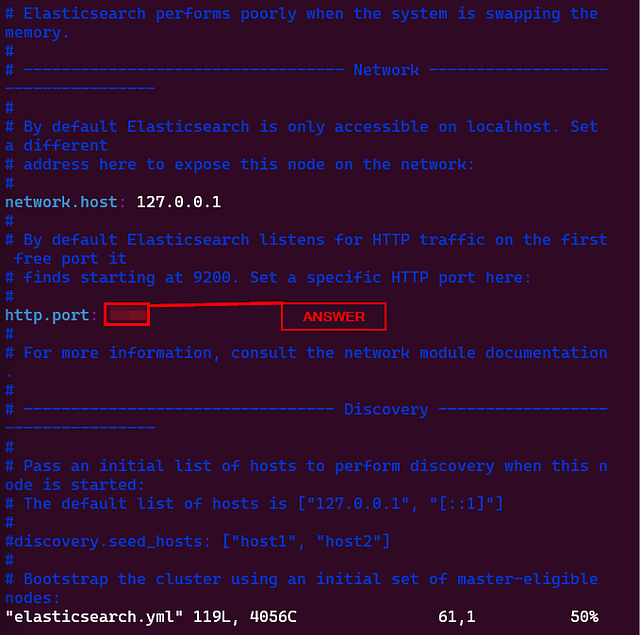
ANSWER: 9200
What version of Elasticsearch we have installed in this task?
The easiest way to find this answer is to scroll up to where we installed the elasticsearch.deb package. Shortly after it started, it shares the version number. Once you find it, type the answer into the THM answer field. Then click Submit.
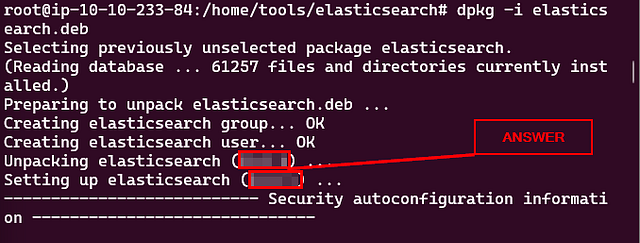
ANSWER: 8.8.1
What is the command used to check the status of Elasticsearch service?
If you have followed through with the above commands. You would have run a command from the Elasticsearch Status. This command is the answer to this question. Type this into the THM answer field, and click Submit.
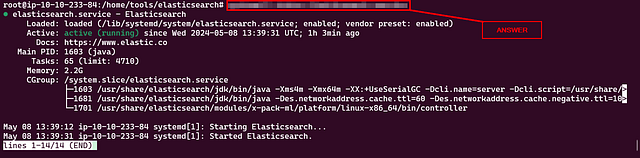
ANSWER: systemctl status elasticsearch.service
What is the default value of the network.host variable found in the elasticsearch.yml file?
If you haven’t changed the elasticsearch.yml file. You can find the answer inside. Again, open the file in your favorite text editor.

Search for network.host, you will be greated with the answer(again, if not changed). If you did end up changing it. Check out this Github, that shares the un-edited version. Once you have found the answer, type it into the THM answer field. The click Submit.
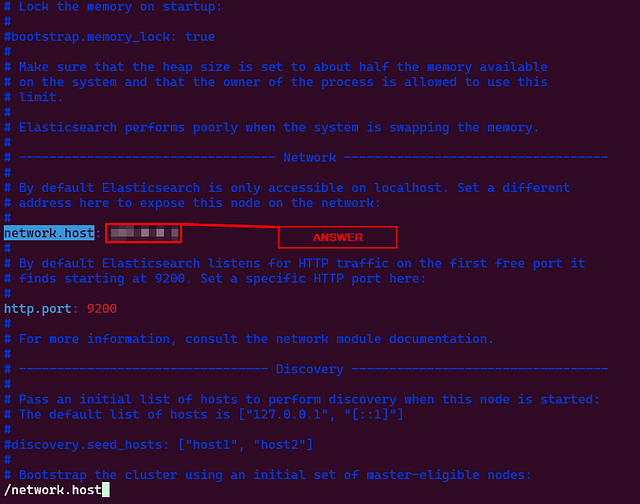
ANSWER: 192.168.0.1
Task 4 Logstash: Installation and Configuration
Installing Logstash

Let’s go through the process of installing Logstash. The latest installation instance is placed on the path /home/tools/logstash.
1
2
root@tryhackme:/home/tools/logstash# ls
logstash.deb
Run the following command dpkg -i logstash.deb as a root user to install the logstash on the server. It will take 1-2 minutes to get installed, as shown below:
1
2
3
4
5
6
root@tryhackme:/home/tools/logstash# dpkg -i logstash.deb
Selecting previously unselected package logstash.
(Reading database ... 321412 files and directories currently installed.)
Preparing to unpack logstash.deb ...
Unpacking logstash (1:8.8.0-1) ...
Setting up logstash (1:8.8.0-1) ...
If all goes well, Logstash will be installed on the host.
Logstash: Persistence
We will use the following commands to make the Logstash service persistent:
1
2
3
root@tryhackme:/home/tools/logstash# systemctl daemon-reload
root@tryhackme:/home/tools/logstash# systemctl enable logstash.service
root@tryhackme:/home/tools/logstash# systemctl start logstash.service
Logstash Status
Now that we have installed Logstash successfully, let’s check its status to see if it’s installed and running properly.
1
2
3
4
5
6
7
8
9
10
11
12
13
14
15
16
17
18
19
20
21
22
23
24
25
root@tryhackme:/home/tools/logstash# systemctl status logstash.service
● logstash.service - logstash
     Loaded: loaded (/lib/systemd/system/logstash.service; enabled; vendor pres>
     Active: active (running) since Wed 2023-06-07 18:29:12 UTC; 28s ago
   Main PID: 482871 (java)
      Tasks: 22 (limit: 4710)
     Memory: 280.7M
     CGroup: /system.slice/logstash.service
             └─482871 /usr/share/logstash/jdk/bin/java -Xms1g -Xmx1g -Djava.awt>

Jun 07 18:29:12 tryhackme systemd[1]: Stopped logstash.
Jun 07 18:29:12 tryhackme systemd[1]: Started logstash.
Jun 07 18:29:12 tryhackme logstash[482871]: Using bundled JDK: /usr/share/logst>
lines 1-12/12 (END)...skipping...
● logstash.service - logstash
     Loaded: loaded (/lib/systemd/system/logstash.service; enabled; vendor preset: enabled)
     Active: active (running) since Wed 2023-06-07 18:29:12 UTC; 28s ago
   Main PID: 482871 (java)
      Tasks: 22 (limit: 4710)
     Memory: 280.7M
     CGroup: /system.slice/logstash.service
             └─482871 /usr/share/logstash/jdk/bin/java -Xms1g -Xmx1g -Djava.awt.headless=true -Dfile.encoding=UTF-8 -Djruby.compile.invokedynamic=true -XX:+HeapDumpOnOutOfMemoryError -Dja>
Jun 07 18:29:12 tryhackme systemd[1]: Stopped logstash.
Jun 07 18:29:12 tryhackme systemd[1]: Started logstash.
Jun 07 18:29:12 tryhackme logstash[482871]: Using bundled JDK: /usr/share/logstash/jdk
Configuring Logstash
In a typical installation of Logstash, the /etc/logstash directory is the default location for important configuration files.
root@tryhackme:/etc/logstash# ls
conf.d jvm.options log4j2.properties logstash-sample.conf logstash.yml pipelines.yml startup.options
Here are some of the important files you may find in the /etc/logstash directory:
logstash.yml: This is the main configuration file for Logstash. It contains global settings and options for Logstash, such as network settings, logging configurations, pipeline configuration paths, and more.jvm.options: This file contains the Java Virtual Machine (JVM) options for Logstash. You can use it to configure parameters like memory allocation, garbage collection settings, and other JVM-related options.log4j2.properties: Logstash uses the Log4j2 framework for logging. This file allows you to configure the logging behavior, including log levels, log outputs (such as console or file), log file locations, and more.pipelines.yml: If you are running multiple pipelines in Logstash, this file is used to define and configure them. It allows you to specify each pipeline’s different inputs, filters, and outputs.conf.d/: This directory is often used to store individual pipeline configuration files. You can create separate configuration files within this directory, each defining a specific data processing pipeline. Logstash will load and process these configuration files in alphabetical order, so it’s common to prefix them with numbers to control the processing order.patterns/: This directory stores custom patterns that can be used in Logstash’s grok filter. Grok is a powerful pattern-matching and extraction tool in Logstash, and you can define your own patterns in separate files within this directory.startup.options: On some systems, you may find this file which contains additional options and arguments that can be passed to Logstash during startup.
Let’s open the logstash.yml using the command nano logstash.yml and go to the Pipeline Configuration Settings section, as shown below:
1
2
3
4
5
6
7
8
9
10
11
12
13
14
15
16
17
18
19
20
# ---------------------------------------Pipeline Configuration Settings------------------------------------------
# Where to fetch the pipeline configuration for the main pipeline
# path.config:
# Pipeline configuration string for the main pipeline
# config.string: # At startup, test if the configuration is valid and exit (dry run)
# config.test_and_exit: false # Periodically check if the configuration has changed and reload the pipeline
# This can also be triggered manually through the SIGHUP signal
# config.reload.automatic: true
#
# How often to check if the pipeline configuration has changed (in seconds)
# Note that the unit value (s) is required. Values without a qualifier (e.g. 60)
# are treated as nanoseconds.
# Setting the interval this way is not recommended and might change in later versions.
# config.reload.interval: 3s
# Show fully compiled configuration as debug log message
# NOTE: --log.level must be 'debug'
# config.debug: false
# When enabled, process escaped characters such as \n and \" in strings in the
# pipeline configuration files.
# config.support_escapes: false
There are two updates that we need to make. Uncomment both the following variables and change the value of config.reload.automatic: to true, as shown below:
- config.reload.automatic: true
- config.reload.interval: 3s
These changes will ensure Logstash looks at the configuration files every 3 seconds to see if there are any changes to the log sources which are being ingested.
1
root@tryhackme:/etc/logstash# systemctl restart logstash.service
Now that we have installed and configured Logstash properly, let’s move on to the next task and install the Kibana component.
Answer the questions below
What is the configuration reload interval set by default in logstash.yml?
Open the logstash.yml file using your favorite text editor. It’s location is etc/logstash/logstash.yml

Once inside the file, search for config.reload.interval. When you find it, type the answer into the THM answer field and click Submit.
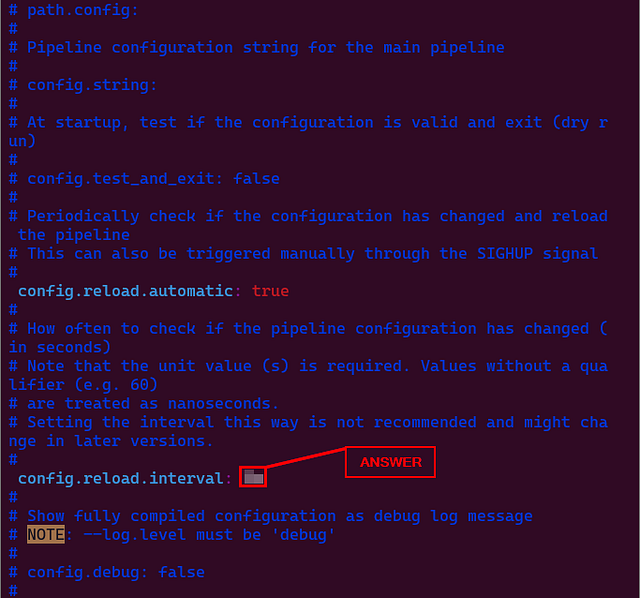
ANSWER: 3s
What is the Logstash version we just installed?
Scroll back up to where you installed Logstash with command dpkg -i logstash.deb. You will be able to find it a couple lines down from where you ran the command. Once you find it, type the answer into the THM answer field. Then click Submit.
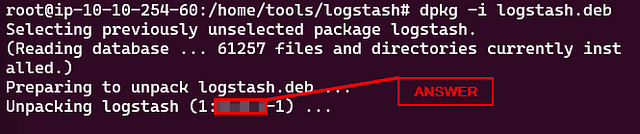
ANSWER: 8.8.1
Task 5 Kibana: Installation and Configuration
Installing Kibana

We have already explored the Kibana interface in the InvestigatingwithELK room. Let’s now go through the process of installing Kibana on the Ubuntu lab. The latest installation instance is placed on the path /home/tools/kibana.
1
2
root@tryhackme:/home/tools/kibana# ls
kibana.deb
Run the following command dpkg -i kibana as a root user to install the Kibana on the server. It will take 1-2 minutes to get installed, as shown below:
1
2
3
4
5
6
7
8
9
root@tryhackme:/home/tools/kibana# dpkg -i kibana.deb
Selecting previously unselected package kibana.
(Reading database ... 321252 files and directories currently installed.)
Preparing to unpack kibana.deb ...
Unpacking kibana (8.8.0) ...
Setting up kibana (8.8.0) ...
Creating kibana group... OK
Creating kibana user... OK
Created Kibana keystore in /etc/kibana/kibana.keystore
If all goes well, Kibana will be installed on the host.
Kibana: Persistence
We will use the following commands to make the Kibana service persistent.
1
2
3
4
root@tryhackme:/etc/kibana# systemctl daemon-reload
root@tryhackme:/etc/kibana# systemctl enable kibana.service
Created symlink /etc/systemd/system/multi-user.target.wants/kibana.service → /lib/systemd/system/kibana.service.
root@tryhackme:/etc/kibana# systemctl start kibana.service
Kibana Status
Now that we have installed Kibana successfully, let’s check its status to see if it’s installed and running properly.
1
2
3
4
5
6
7
8
9
10
11
12
13
14
15
16
17
18
19
20
21
root@tryhackme:/etc/kibana# systemctl status kibana.service
● kibana.service - Kibana
     Loaded: loaded (/lib/systemd/system/kibana.service; enabled; vendor preset: enabled)
     Active: active (running) since Wed 2023-06-07 14:08:06 UTC; 36s ago
       Docs: https://www.elastic.co
   Main PID: 6251 (node)
      Tasks: 11 (limit: 4710)
     Memory: 388.5M
     CGroup: /system.slice/kibana.service
             └─6251 /usr/share/kibana/bin/../node/bin/node /usr/share/kibana/bin/../src/cli/dist

Jun 07 14:08:33 tryhackme kibana[6251]: [2023-06-07T14:08:33.621+00:00][INFO ][plugins-service] Plugin "cloudExperiments" is disabled.
Jun 07 14:08:33 tryhackme kibana[6251]: [2023-06-07T14:08:33.621+00:00][INFO ][plugins-service] Plugin "cloudFullStory" is disabled.
Jun 07 14:08:33 tryhackme kibana[6251]: [2023-06-07T14:08:33.621+00:00][INFO ][plugins-service] Plugin "cloudGainsight" is disabled.
Jun 07 14:08:33 tryhackme kibana[6251]: [2023-06-07T14:08:33.666+00:00][INFO ][plugins-service] Plugin "profiling" is disabled.
Jun 07 14:08:33 tryhackme kibana[6251]: [2023-06-07T14:08:33.799+00:00][INFO ][http.server.Preboot] http server running at http://localhost>
Jun 07 14:08:34 tryhackme kibana[6251]: [2023-06-07T14:08:34.006+00:00][INFO ][plugins-system.preboot] Setting up [1] plugins: [interactive>
Jun 07 14:08:34 tryhackme kibana[6251]: [2023-06-07T14:08:34.010+00:00][INFO ][preboot] "interactiveSetup" plugin is holding setup: Validat>
Jun 07 14:08:34 tryhackme kibana[6251]: [2023-06-07T14:08:34.054+00:00][INFO ][root] Holding setup until preboot stage is completed.
Jun 07 14:08:34 tryhackme kibana[6251]: i Kibana has not been configured.
Jun 07 14:08:34 tryhackme kibana[6251]: Go to http://localhost:5601/?code=475559 to get started.
Configuring Kibana
The /etc/kibana path typically contains the configuration files for Kibana, an open-source data visualization and exploration tool. Here are the commonly found files in the /etc/kibana directory:
1
2
root@tryhackme:/etc/kibana# ls
kibana.keystore  kibana.yml  node.options
Two important files are explained below:
- kibana.yml: This is the main configuration file for Kibana. It contains various settings to customize Kibana’s behavior, such as the Elasticsearch server URL, server host and port, logging options, security configurations, and more. You can modify this file to tailor Kibana to your specific environment.
- kibana.keystore: This file securely stores sensitive configuration settings, such as passwords and API keys. The
kibana.keystorefile provides a safer alternative to storing sensitive information in plain text within thekibana.ymlfile. It is encrypted and can be managed using thebin/kibana-keystorecommand-line tool.
To configure Kibana, open the kibana.yml using the command nano kibana.yml and go to the System: Kibana Server section, as shown below:
1
2
3
4
5
6
7
8
9
10
11
12
13
14
15
16
17
18
19
20
21
22
23
24
25
26
27
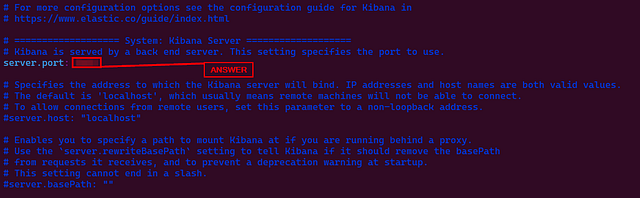
# =================== System: Kibana Server ===================
# Kibana is served by a back end server. This setting specifies the port to use.
server.port: 5601
# Specifies the address to which the Kibana server will bind. IP addresses and host names are both valid values.
# The default is 'localhost', which usually means remote machines will not be able to connect.
# To allow connections from remote users, set this parameter to a non-loopback address.
server.host: "0.0.0.0"
# Enables you to specify a path to mount Kibana at if you are running behind a proxy.
# Use the `server.rewriteBasePath` setting to tell Kibana if it should remove the basePath
# from requests it receives, and to prevent a deprecation warning at startup.
# This setting cannot end in a slash.
#server.basePath: ""
....
.........
...........
# =================== System: Elasticsearch ===================
# The URLs of the Elasticsearch instances to use for all your queries.
elasticsearch.hosts: ["http://localhost:9200"]
# If your Elasticsearch is protected with basic authentication, these settings provide
# the username and password that the Kibana server uses to perform maintenance on the Kibana
# index at startup. Your Kibana users still need to authenticate with Elasticsearch, which
# is proxied through the Kibana server.
#elasticsearch.username: "kibana_system"
#elasticsearch.password: "pass"
Uncomment the following two variables and make the changes to server.host as shown below:
server.port: 5601=> Kibana runs on port 5601 by default.server.host: "0.0.0.0"=> This is important to note that; if the server IP is changed, it should be updated here. The server’s IP does not change in a production environment; in that case, this parameter will not be changed often.
Once the changes are made, and the config file is saved, its time to restart the Kibana server using the following command:
1
root@tryhackme:/etc/kibana# systemctl restart kibana.service
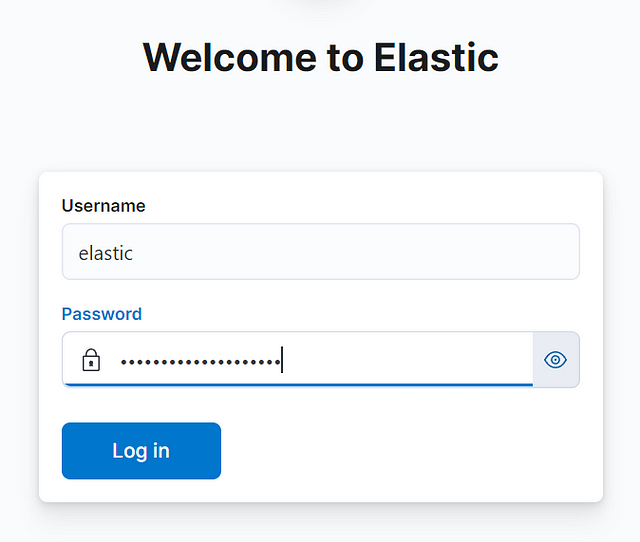
Open the browser, and go to MACHINE_IP:5601; we will see a Kibana Interface. We will need to generate an enrollment token for the Kibana instance using the following command /usr/share/elasticsearch/bin/elasticsearch-create-enrollment-token -s kibana. It will show a randomly generated token. Enter the token in the space and press Enter. It will ask for the elastic credentials. There are the same credentials that were generated during the installation of Elasticsearch:
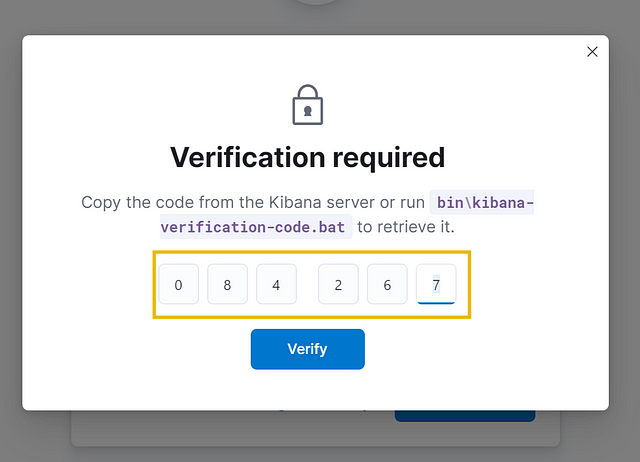
Next, it will ask for the verification code, which can be obtained by running this command /usr/share/kibana/bin/kibana-verification-code
Congrats, ELK is installed properly:
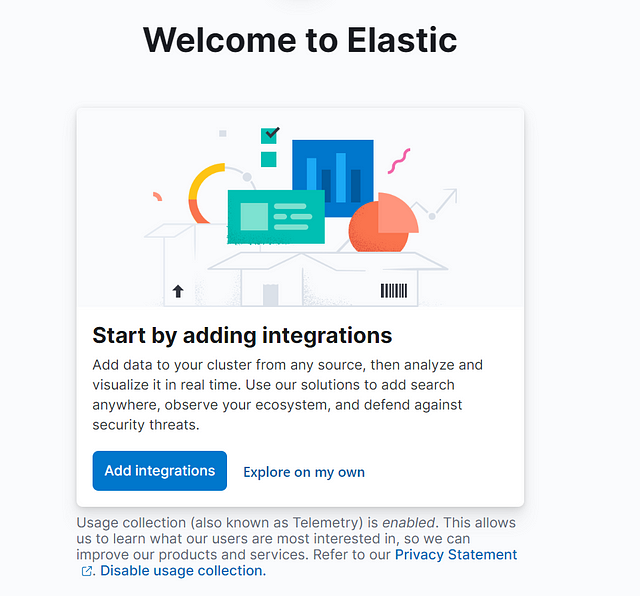
Kibana can be used to visualize the logs that are parsed, and filtered from Logstash.
Note: As we are focused on Logstash in this room, please stop the Kibana service to avoid VM slowing down. Use the command systemctl stop kibana.service to stop Kibana.
Answer the questions below
What is the default port Kibana runs on?
We can find the port in the kibana.yml file. Let’s start off by opening the file, I am using vim.

If you have already removed the comment. You should easily see service.port. The number to the right of this, is the default port Kibana uses. Type this number into the TryHackMe answer field, then click Submit.
ANSWER: 5601
How many files are found in /etc/kibana/ directory?
This can done by using the ls command. Running the command ls /etc/kibana/ will display the contents of the kibana dirctory. Count the number of files in this directory, and you will have the answer. Type the answer into the THM answer field, then click Submit.

ANSWER: 3
Task 6 Logstash: Overview
Let’s dive deep into the details of Logstash.
Logstash is a data processing engine that takes data from different sources, applies the filter or normalizes it, and then sends it to the destination, Kibana, or a listening port. A Logstash configuration file is divided into three parts, as shown below.
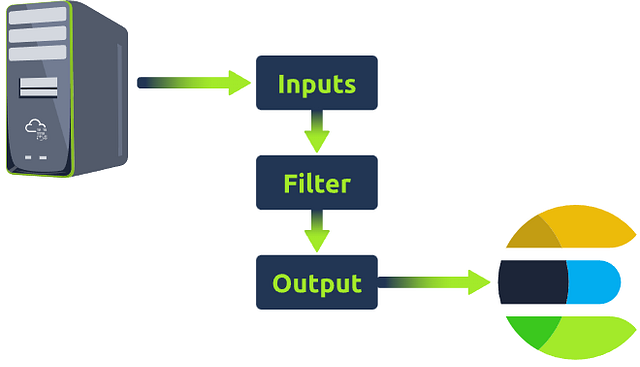
Each part is explained in detail below:
Input
Logstash provides a wide range of input plugins that allow you to ingest data from diverse sources such as log files, system metrics, databases, message queues, APIs, and more. These input plugins facilitate data collection in various formats and protocols, as shown in the reference document.
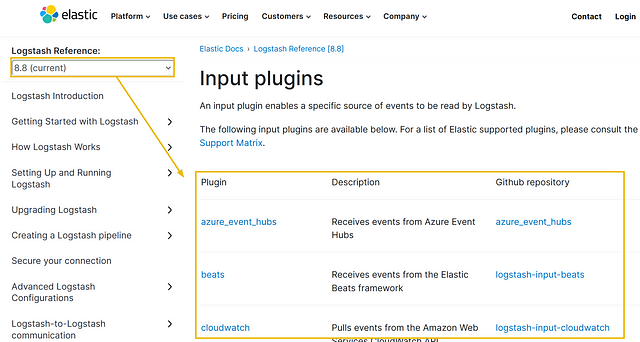
Below is the list of the top 10 input plugins with a brief explanation:
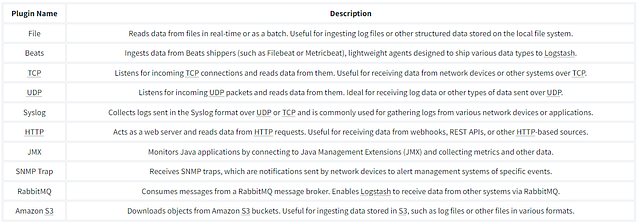
Filter
Once the data is ingested, Logstash provides a rich set of filter plugins that enable you to manipulate and transform the data. Filters allow you to parse, enrich, modify, and filter incoming data. You can perform operations like extracting specific fields, converting data formats, applying regular expressions, adding timestamps, and enriching data with external sources. Logstash supports many filter plugins, as shown in the reference documentation.
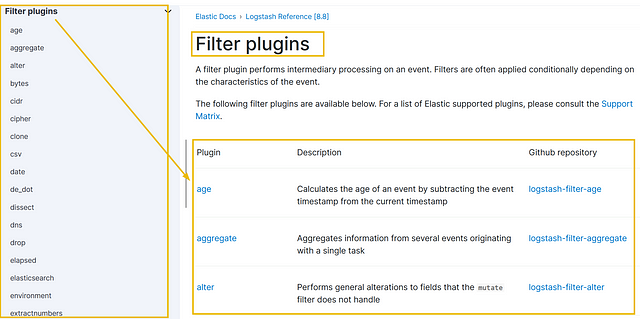
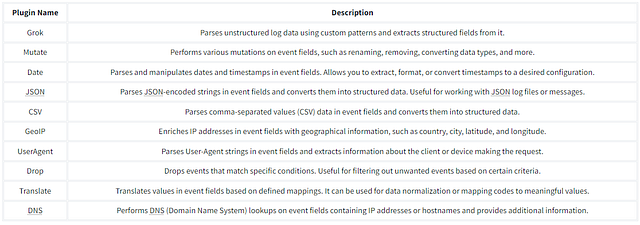
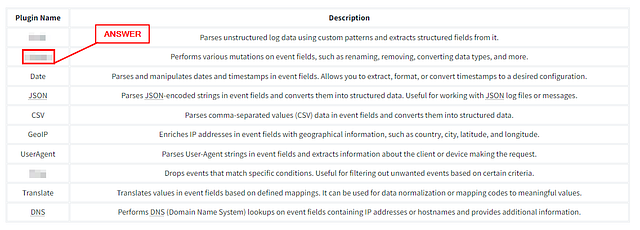
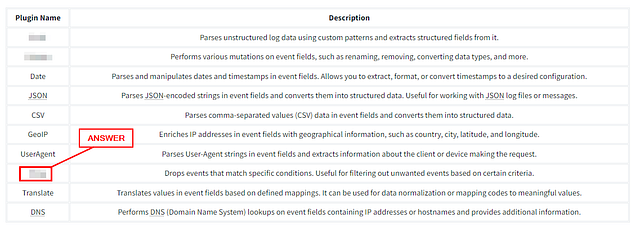
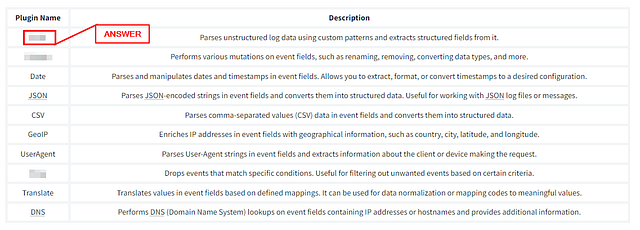
It’s important to note that the filter part is optional. Whether we want to apply filters or not depends on the use case. Below is the list of the top 10 input plugins with a brief explanation:
Output
After the data is processed through filters, Logstash provides output plugins to send the transformed data to different destinations. These destinations can include Elasticsearch for indexing and search, various databases, message queues, cloud storage services, monitoring systems, and more. The reference documentation shows that Logstash supports various output plugins to accommodate different integration requirements.
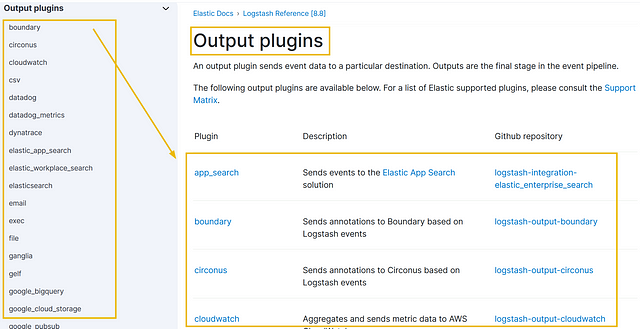
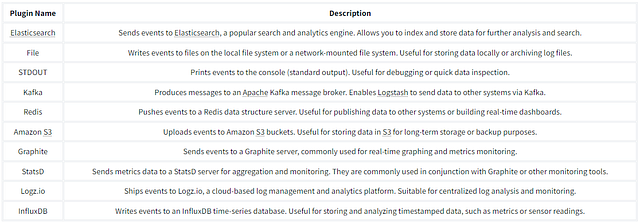
We can use one or more output destinations depending on the requirement. Some of the common output plugins are explained below:
In the coming tasks, we will use most of these plugins to get the data, parse, and output to the destination of choice.
Answer the questions below
The answers in this section can be found above. So I won’t be sharing them here. I will just let you know where to find them.
Which plugin is used to perform mutation of event fields?
You can find this answer in the Filter section above. If you read the question carefully, the answer will stand out. Once you find it, type the answer into the TryHackMe answer field. Then click Submit.
Which plugin can be used to drop events based on certain conditions?
Reading the question carefully, then going back to the Filter section. You should be able to find the the answer easily. Once you find it, type the answer into the TryHackMe answer field. Then click Submit.
Which plugin parses unstructured log data using custom patterns?
Lastly, going back to the filter section. You should be able to find the answer, as the most of the question appears in the description. Once you find it, type the answer into the TryHackMe answer field. Then click Submit.
Task 7 Writing Configurations
While setting up Logstash, we made the changes in the Logstash configuration file logstash.yml to look at the configurations every 3 seconds to observe the changes to the files it monitors. The configuration files are located in the /etc/logstash/conf.d/ directory. Let’s now go through the process of writing a simple configuration file.
Example:
Take the input from TCP port 5456, which sends JSON formatted logs, apply the appropriate filter, and send it to Elasticsearch.
1) Input: tcp
For the above example, we will take a look at the TCP plugin documentation. In the configuration options, only the port field is required, which means we can use the TCP plugin by only mentioning the TCP port, which we want the Logstash to listen to.
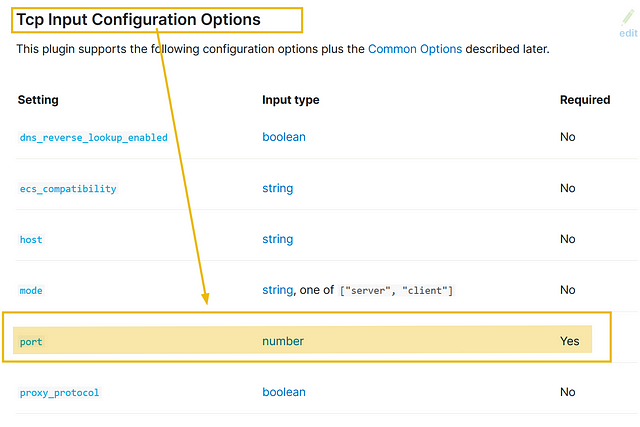
The input part of the configuration based on the above information would look like:
1
2
3
4
5
input                                                                                                                                                  {
       tcp {
               port => 5456
           }
 }
It is important to note that, in the configurations, we will use => the field value pairs, as shown in the above example.
2) Filter
The input stream is in JSON format; let’s explore the JSON plugin documentation and see which fields are required.
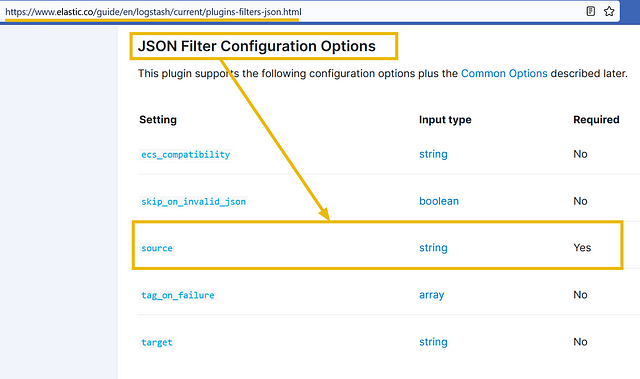
The configuration shows we need to mention the source. Click on the source field, and it will show further details on how to use this option, along with the example.
Based on the information provided above, our filter configuration would be:
1
2
filter
json      { source => "message"       } }
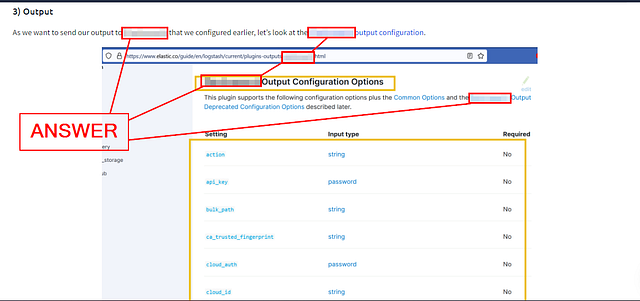
3) Output
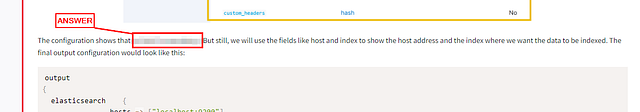
As we want to send our output to Elasticsearch that we configured earlier, let’s look at the Elasticsearch output configuration.
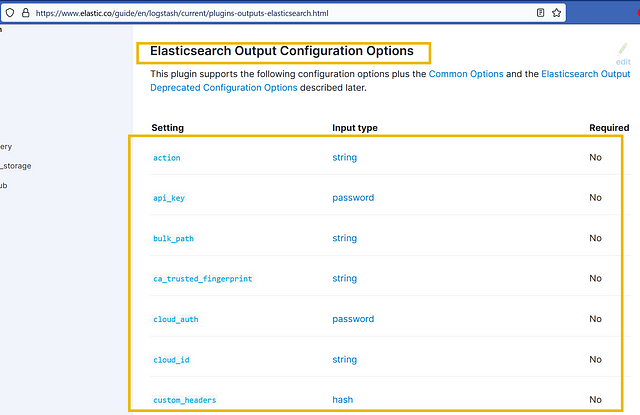
The configuration shows that no field is mandatory. But still, we will use the fields like host and index to show the host address and the index where we want the data to be indexed. The final output configuration would look like this:
1
2
3
4
5
6
7
output                                                                                                                                      {
  elasticsearch    {
                hosts => ["localhost:9200"]
                index => "your_index_name"
      }

}
Final Configuration:
Now that we have written the configuration that takes the input from the TCP port 5456, applies the filter and sends it to Elasticsearch, our final configuration would look like this:
1
2
3
4
5
6
7
8
9
10
11
12
13
14
15
16
17
18
input                                                                                                                                      {
  tcp    {
    port => 5456
      }
}

filter {
         json      {
        source => "message"
      }
    }
output  {
       elasticsearch            {
    hosts => ["localhost:9200"]
                 index => "your_index_name"
             }

}
What’s next? We will save this configuration with the extension <any name>.conf into the path /etc/logstash/conf.d/ to make it work.
In the next task, we will create some configurations using different plugins.
Answer the questions below
Is index a mandatory option in Elasticsearch plugin? (yay / nay)
You can find the answer to this question in the infomation provided in this task. So I won’t give the answer below. Scroll up to the output section. You will be able to find the answer after the screen shot from the Elasticsearch output configuration page. Read the first part of the paragrah and you should be able to find out. Once you do, type the answer in the TryHackMe answer field. Then click Submit.
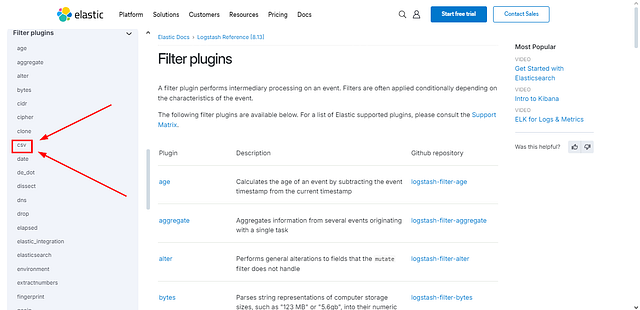
Look at the file input plugin documentation; which field is required in the configuration?
To find this answer, we need to start at the Input Plugin page. You will need to open it in a new tab, which can be done by holding the ctrl and clicking the link. You can use the link I provided above, or go back to task 6 under Input and use the reference document.

You will be brought to the Input plugin page. If you look on the left side of the page, you will see the different input plugins. Look down through this list till yo use file and click on it.
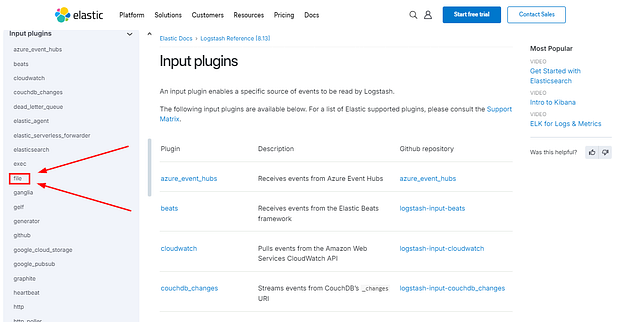
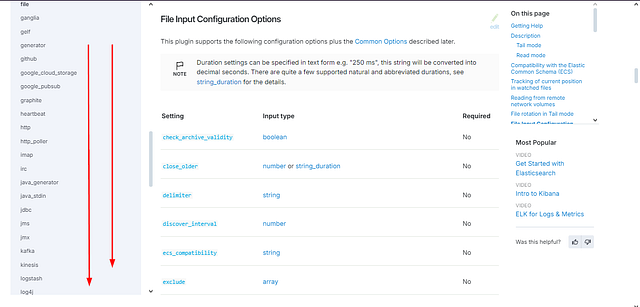
We should now be on the File input plugin page. Time to scroll down till we see File Input Configuration Options.
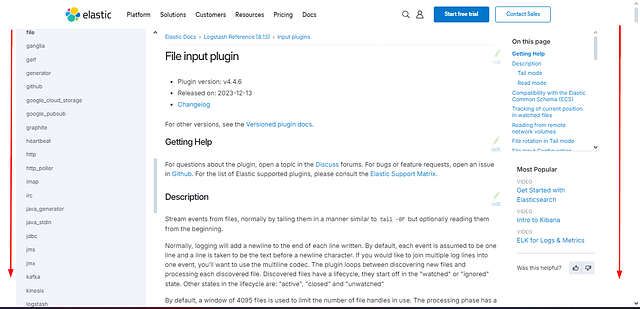
When you reach the File Input Configuration Options section. We can see lots of different settings that can be used. Start parsing through this information till you find the one setting that is required. This is the answer to the question. Type the answer into the TryHackMe answer field. Then click Submit.
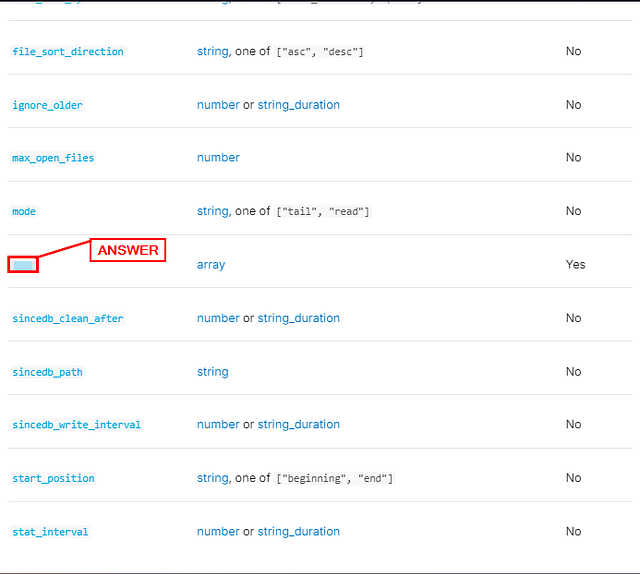
ANSWER: path
Look at the filter documentation for CSV; what is the third field option mentioned?
Heading back over to the File Input Configuration Options page. We use the left side that has the different plugins on it. Scroll down through the different plugins, till you see Filter Plugin, then click on it.
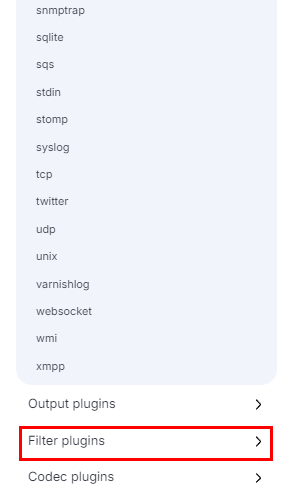
We should now be on the Filter Plugins page. Looking again at the column on the left, we can now see the different Filter Plugins that can be used. Look for csv, once you find it, click on it.
We have reached the CSV Filter Plugin page. This time instead of scrolling down. We can click the link Csv Filter Configuration Options, located on the right side. Under the section labeled On this page.
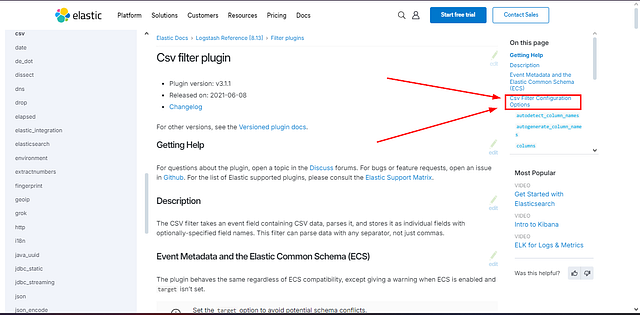
We are not at the Csv Filter Configuration Options section. Look at the third row under Setting in this table. We have found the answer. Go ahead and type it over in the TryHackMe answer field. Then click Submit.
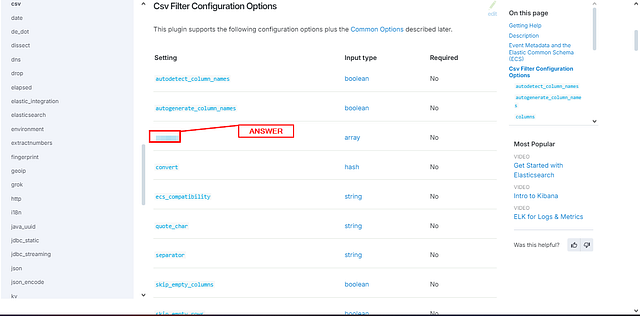
ANSWER: columns
Which output plugin is used in the above example?
As with the first question on this task. I won’t give the answer as you can find it easlier above. So I am just going to show you where to look. Scroll up till you reach 3) Output. You should be able to find the plugin name in this section, as it appears at least 5 times from what I can find. Once you find it, type the answer into the TryHackMe answer field. Then click Submit.
Task 8 Logstash: Input Configurations

So far, we have explored Logstash, its components, and how different plugins are used with the help of official documentation. Let’s explore a few common input plugins and their usages, along with the corresponding configurations:
File Input Plugin
This plugin reads data from files on the local system or network.
1
2
3
4
5
6
7
8
9
input
{
     file
          {
                     path => "/path/to/your/file.log"
                     start_position => "beginning"
                     sincedb_path => "/dev/null"
           }
 }
path: Specifies the path to the file(s) to be read.start_position: Defines where Logstash should start reading the file. In this example, “beginning” means it will start reading from the beginning of the file.sincedb_path: Sets the path to the sincedb file, which keeps track of the current position of the file read.
Beats Input Plugin
This plugin receives data from Beats, lightweight shippers that send data to Logstash.
1
2
3
4
5
6
7
input
{
    beats
          {
                     port => 5055
           }
 }
port: Specifies the port number on which Logstash should listen for Beats connections.
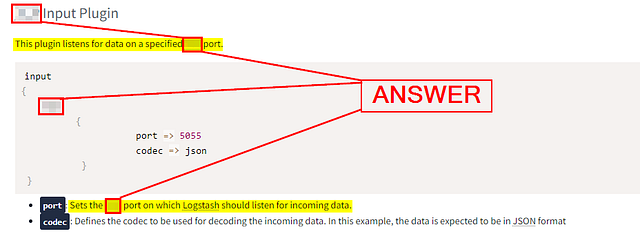
TCP Input Plugin
This plugin listens for data on a specified TCP port.
1
2
3
4
5
6
7
8
input
{
    tcp
          {
                     port => 5055
                     codec => json
           }
 }
port: Sets the TCP port on which Logstash should listen for incoming data.codec: Defines the codec to be used for decoding the incoming data. In this example, the data is expected to be in JSON format
UDP Input Plugin
This plugin listens for data on a specified UDP port.
1
2
3
4
5
6
7
8
input
{
    udp
          {
                     port => 514
                     codec => "plain"
           }
 }
port: Sets the UDP port on which Logstash should listen for incoming data.codec: Specifies the codec to be used for decoding the incoming data. In this example, the data is treated as plain text.
HTTP Input Plugin
This plugin sets up an HTTP endpoint to receive data via HTTP requests.
1
2
3
4
5
6
7
input
{
    http
          {
                     port => 5055
           }
 }
port: Specifies the HTTP port on which Logstash should listen for incoming HTTP requests
Each input plugin provides specific configuration options tailored to its functionality and requirements. The examples above demonstrate configuring the plugins by specifying the necessary settings, such as file paths, ports, and codecs. You can further customize these configurations based on your specific use case and the data sources you are working with. The Logstash documentation provides comprehensive information on each input plugin and its available configuration options.
Answer the questions below
The answers in this section can be found above and/or if you read the questions carefully. So I won’t be sharing them here. I will just let you know where I was able to find them.
If we want to read a constant stream from a TCP port 5678, which input plugin will be used?
Reading through this question carefully, as you should be able to figure the answer out. In the question it is asking about a constant stream from a TCP port 5678. If you are still not sure, after reading over the italisised letters in the previous sentence. Head up to the TCP Input Plugin section. Read the first sentence. Once you have found the answer, type it into the TryHackMe answer field. Then click Submit.
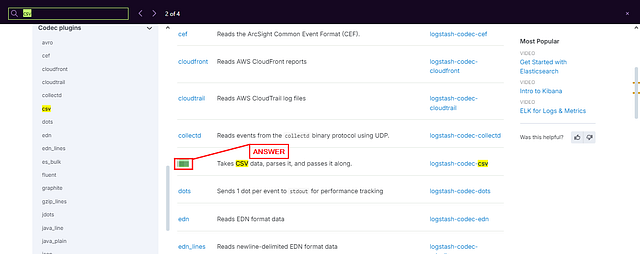
According to the Logstash documentation, the codec plugins are used to change the data representation. Which codec plugin is used for the CSV based data representation?
Again, reading through this question carefully, as you should be able to figure the answer out. If your still having issues, you can open the link provided in the question. Once on the page, use the find feature (ctrl + f ). In the find bar, type csv. You will find 4 results, the second result should be what you are looking for. Once you see it, type the answer into the TryHackMe answer field. Then click Submit.

Task 9 Logstash: Filter Configurations
Filters

Let’s now explore different filter plugins and how they are used in Logstash configuration with some examples:
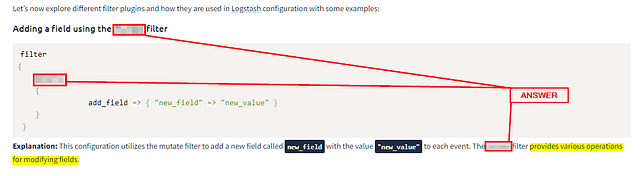
Adding a field using the mutate filter
1
2
3
4
5
6
7
filter
{
    mutate
    {
                add_field => { "new_field" => "new_value" }
    }
 }
Explanation: This configuration utilizes the mutate filter to add a new field called new_field with the value "new_value" to each event. The mutate filter provides various operations for modifying fields.
Converting a field to lowercase using the mutate filter
1
2
3
4
5
6
7
filter
{
    mutate
    {
                lowercase => ["field_name"]   }
    }
 }
Explanation: This configuration employs the mutate filter to convert the value of the field_name field to lowercase. The original value will be replaced with its lowercase equivalent.
Extracting data using the grok filter
1
2
3
4
5
6
7
filter
{
    grok
    {
                match => { "message" => "%{PATTERN:field_name}" }
    }
 }
Explanation: This configuration uses the grok filter to extract data from the message field based on a predefined pattern (%{PATTERN}). The extracted data will be stored in a new field called field_name.
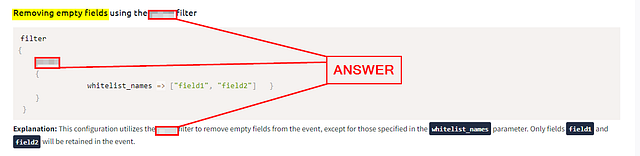
Removing empty fields using the prune filter
1
2
3
4
5
6
7
filter
{
    prune
    {
                whitelist_names => ["field1", "field2"]   }
    }
 }
Explanation: This configuration utilizes the prune filter to remove empty fields from the event, except for those specified in the whitelist_names parameter. Only fields field1 and field2 will be retained in the event.
Replacing field values using the translate filter
1
2
3
4
5
6
7
8
9
filter
{
    translate
    {
                field => "country"
                destination => "country_name"
                dictionary => {       "US" => "United States"   "CA" => "Canada"   }
    }
 }
Explanation: This configuration utilizes the translate filter to replace the value of the country field with its corresponding value from the dictionary. For example, if the country field is "US", it will be replaced with "United States", and if it is "CA", it will be replaced with "Canada".
Dropping events based on a condition using the if-else statement
1
2
3
4
5
6
7
8
filter
{
   if [status] == "error"
   {     drop { }
     }
   else {
      # Perform additional transformations or filters   }
 }
Explanation: In this configuration, the if-else statement checks the value of the status field. If the value is "error", the event is dropped using the drop filter. Otherwise, if the condition is not met, the event proceeds for further transformations or filters.
Parsing key-value pairs using the kv filter
1
2
3
4
5
6
7
filter
{
    kv
    {
        field_split => "&"     value_split => "="
    }
 }
Explanation: This configuration uses the kv filter to parse key-value pairs in a field. The field_split parameter specifies the delimiter between key-value pairs (& in this case), and the value_split parameter specifies the delimiter between keys and values (= in this case).
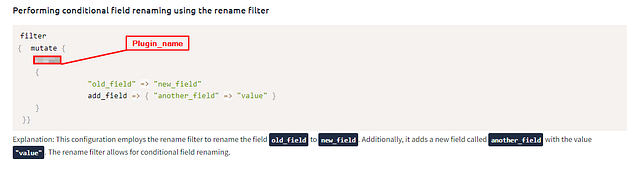
Performing conditional field renaming using the rename filter
1
2
3
4
5
6
7
8
filter
{  mutate {
    rename
    {
                "old_field" => "new_field"
                add_field => { "another_field" => "value" }
    }
 }}
Explanation: This configuration employs the rename filter to rename the field old_field to new_field. Additionally, it adds a new field called another_field with the value "value". The rename filter allows for conditional field renaming.
Answer the questions below
Which filter plugin is used to remove empty fields from the events?
You can easily find this in the above section that starts with Removing empty fields. Once in this section you will see the name of the filter used to remove the empty fields. When you find it, type the answer into the TryHackMe answer field. Then click Submit.
Which filter plugin is used to rename, replace, and modify event fields?
You are able to find this answer by looking at the first section. In the first section, it describes a filter that can modify fields. Once you find it, type the answer into the TryHackMe answer field. Then click Submit.
ANSWER: mutate
Add plugin Name to rename the field ‘src_ip’ to ‘source_ip.’ And the fixed third line.
1
2
3
4
5
6
7
filter
{
    mutate
     {
             plugin_name = { "field_1" = "field_2" }
      }
}
Answer only the corrected third line.
We are given an example above, of the three names we need to change to correct this configuration. They are plugin_name, field_1, and field_2. We can look at the last section above as it relates to plugin name and renaming fields.
Now we have the plugin name and how we need to lay out our command. Just as a reminder, we need to rename src_ip to source_ip. Using this knowledge, we can build the third line to look like the following: plugin_name => { "Old_Field_Name" => "New_Field_Name" }. Make sure you have the spaces in the correct places, along with using double quotes. Type it all up in the TryHackMe answer field. The click Submit.
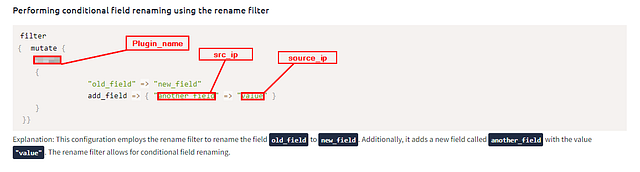
ANSWER: rename => { “src_ip” => “source_ip” }
Task 10 Logstash: Output Plugins

Output
The output section of the Logstash configuration file is where you define the destination for processed events. It specifies where Logstash should send the transformed data. Some of the common examples of Logstash output plugins and their configurations:
Sending data to Elasticsearch using the elasticsearch output plugin
1
2
3
4
5
6
7
8
output
{
    elasticsearch
    {
                hosts => ["localhost:9200"]
                index => "my_index"
    }
 }
Explanation: This configuration uses the elasticsearch output plugin to send events to an Elasticsearch cluster. The hosts parameter specifies the Elasticsearch server’s address and defines the index name where the data will be stored.
Writing data to a file using the file output plugin
1
2
3
4
5
6
7
output
{
    file
    {
                path => "/path/to/output.txt"
    }
 }
Explanation: This configuration utilizes the file output plugin to write events to a specified file (/path/to/output.txt). Each event will be appended to the file as a separate line.
Sending data to a message queue using the rabbitmq output plugin
1
2
3
4
5
6
7
8
9
output
{
   rabbitmq
   {
               host => "localhost"
               exchange => "my_exchange"
               routing_key => "my_routing_key"
    }
 }
Explanation: This configuration configures the rabbitmq output plugin to send events to a RabbitMQ server. The host parameter specifies the RabbitMQ server’s address, while exchange and routing_key define the exchange and routing key for message routing within RabbitMQ.
Forwarding data to another Logstash instance using the logstash output plugin
1
2
3
4
5
6
7
output
{
    logstash
       {
                host => "destination_host"
                port => 5000   }
 }
Explanation: This configuration sets up the logstash output plugin to forward events to another Logstash instance. The host parameter specifies the destination Logstash server’s address, and the port parameter defines the port to which the events will be sent.
Sending data to a database using the jdbc output plugin
1
2
3
4
5
6
7
8
9
output
{
    dbc
    {
        connection_string => "jdbc:mysql://localhost:3306/mydb"
        statement => "INSERT INTO mytable (field1, field2) VALUES (?, ?)"
        parameters => ["%{field1}", "%{field2}"]
    }
 }
Explanation: This configuration utilizes the jdbc output plugin to insert events into a MySQL database. The connection_string parameter specifies the database connection details, and the statement parameter defines the SQL INSERT statement. The parameters parameter provides values for the placeholders in the statement.
Forwarding data to a TCP server using the tcp output plugin
1
2
3
4
5
6
7
8
output
{
    tcp
    {
        host => "destination_host"
        port => 5000
    }
 }
Explanation: This configuration sets up the tcp output plugin to forward events to a remote TCP server. The host parameter specifies the destination server’s address, and the port parameter defines the port to which the events will be sent.
Sending data to a message broker using the kafka output plugin
1
2
3
4
5
6
7
8
output
{
    kafka
      {
              bootstrap_servers => "kafka_host:9092"
              topic_id => "my_topic"
      }
 }
Explanation: This configuration utilizes the kafka output plugin to publish events to an Apache Kafka topic. The bootstrap_servers parameter specifies the Kafka server’s address, and the topic_id parameter defines the topic to which the events will be sent.
Forwarding data to a WebSocket endpoint using the websocket output plugin
1
2
3
4
5
6
7
output
{
   websocket
        {
                url => "ws://localhost:8080/my_endpoint"
        }
 }
Explanation: This configuration creates the websocket output plugin to send events to a WebSocket endpoint. The url parameter specifies the WebSocket server’s URL and the specific endpoint (/my_endpoint) to which the events will be sent.
Sending data to a Syslog server using the syslog output plugin
1
2
3
4
5
6
7
8
9
output
{
     syslog
             {
                 host => "syslog_server"
                 port => 514
                 protocol => "udp"
             }
 }
Explanation: This configuration configures the syslog output plugin to send events to a Syslog server. The host parameter specifies the Syslog server’s address, the port parameter defines the port to which the events will be sent, and the protocol parameter specifies the transport protocol (in this case, UDP).
Writing data to the console for debugging using the stdout output plugin
1
2
3
4
5
output
{
    stdout {
    }
 }
Explanation: This configuration uses the stdout output plugin to print events to the console. It is primarily used for debugging purposes to visually inspect the processed events and verify the Logstash pipeline’s transformations.
These examples demonstrate a variety of output plugins available in Logstash, each serving a specific purpose to send data to different destinations or systems. We can choose the appropriate output plugin based on our requirements and desired data flow.
Answer the questions below
Can we use multiple output plugins at the same time in order to send data to multiple destinations? (yay / nay)
Reading through the last little paragraph of this task, along with all the different examples of output given above. Not to mention the format of json, it seems pretty safe to say that the answer is ***. Sorry, not give the answer away here, this it can easily be figured out. Once you do, type the answer into the TryHackMe answer field. Then click Submit.

Which Logstash output plugin is used to print events to the console?
Scroll up to the final example of an output plugin. Reading through you should be able to find the answer. Once you do, type it into the TryHackMe answer field. Then click Submit.

Update the following configuration to send the event to the Syslog server.
1
2
3
4
5
6
output {
  plugin {
    field1 => "my_host.com"
    field2 => 514
  }
}
Using the information given to us by TryHackMe, the config and that we are sending it to Syslog. You can scroll up to the section starting with Sending data to a Syslog server. In this section, it will have an example sharing the name of the plugin. Along with the names of Field1 and Field2. After reading over the example, you should be able to discern the answer to the question. Make sure you use the comman seperate value style: plugin,field1,field2. Once you have it figured out, type the answer into the TryHackMe answer field. The click Submit.
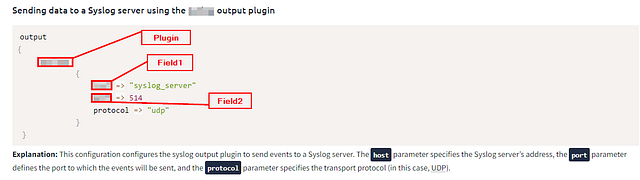
ANSWER: syslog,host,port
Task 11 Logstash: Running Configurations
Let’s recall the Logstash components below.
This image can be represented in configuration as follows:
1
2
3
4
5
6
7
input
{
 filter {
    }
output{

}
Logstash configurations are placed at /etc/logstash/conf.d/ for the logstash to read.
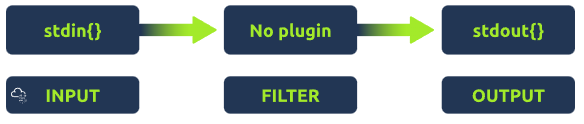
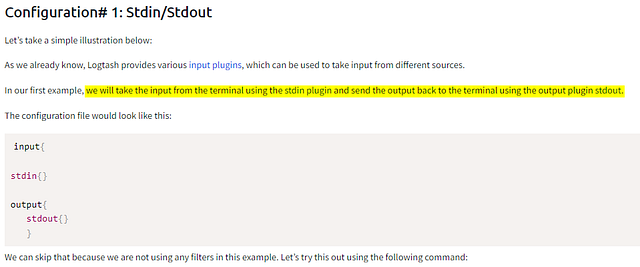
Configuration# 1: Stdin/Stdout
Let’s take a simple illustration below:
As we already know, Logtash provides various input plugins, which can be used to take input from different sources.
In our first example, we will take the input from the terminal using the stdin plugin and send the output back to the terminal using the output plugin stdout.
The configuration file would look like this:
1
2
3
4
5
6
7
input{

stdin{}

output{
   stdout{}
   }
We can skip that because we are not using any filters in this example. Let’s try this out using the following command:
1
2
3
4
5
6
7
8
9
10
11
12
13
14
15
16
17
18
19
20
21
22
23
24
25
26
27
28
29
30
31
32
/usr/share/logstash/bin/logstash -e 'input{ stdin{}} output{ stdout{} }'

root@tryhackme:/usr/share/logstash# ./bin/logstash -e 'input{stdin{}} output{stdout{}}'
......
......
HELLO
WARNING: Could not find logstash.yml which is typically located in $LS_HOME/config or /etc/logstash. You can specify the path using --path.settings. Continuing using the defaults
Could not find log4j2 configuration at path /usr/share/logstash/config/log4j2.properties. Using default config which logs errors to the console

{
      "@version" => "1",
          "host" => {
        "hostname" => "ip-10-10-156-46"
    },
       "message" => "HELLO",
    "@timestamp" => 2023-06-08T15:05:23.141844620Z,
         "event" => {
        "original" => "HELLO"
    }
}
Welcome to the TRYHACKME Learning Lab
{
      "@version" => "1",
          "host" => {
        "hostname" => "ip-10-10-156-46"
    },
       "message" => "Welcome to the TRYHACKME Learning Lab",
    "@timestamp" => 2023-06-08T15:05:47.309850247Z,
         "event" => {
        "original" => "Welcome to the TRYHACKME Learning Lab"
    }
}
In the above examples, we entered two inputs HELLO and Welcome to the TRYHACKME Learning Lab. Both were reflected back on the terminal, as we used stdout to output the data without applying any filters.
Configuration #2: Reading authentication logs
Now, we will see how we can get authentication logs located at /var/log/auth.log, apply some filters, and send them over to the destination of our choice.
1
2
3
4
5
6
7
8
9
10
11
12
13
14
15
16
17
18
19
20
21
22
23
input {
  file {
    path => "/var/log/auth.log"
    start_position => "beginning"
    sincedb_path => "/dev/null"
  }
}

filter {
  if [message] =~ /^(\w{3}\s+\d{1,2}\s+\d{2}:\d{2}:\d{2})/
  {
    # Extract the timestamp from the log entry
    date {
      match => [ "message", "MMM d HH:mm:ss", "MMM dd HH:mm:ss" ]
      target => "@timestamp"
    }
  }
}
output {
  file {
    path => "/root/home/Desktop/logstash_output.log"
  }
}
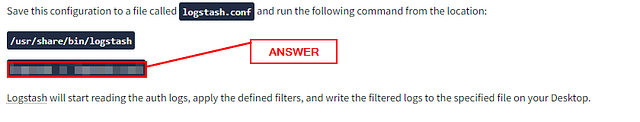
Save this configuration to a file called logstash.conf and run the following command from the location:
/usr/share/bin/logstash
logstash -f logstash.conf
Logstash will start reading the auth logs, apply the defined filters, and write the filtered logs to the specified file on your Desktop.
Answer the questions below
Which command is used to run the logstash.conf configuration from the command line?
You can easily find this answer by scrolling up as the last section before the questions. Once you find it, type the answer into the TryHackMe answer field. Then click Submit.
What will be the input, filter, and output plugins in the below-mentioned configuration if we want to get the comma-separated values from the command line, and apply the filter and output back to the terminal to test the result?
1
2
3
4
5
6
7
8
9
input{
input_plugin{}

filter{
filter_plugin{}
}
output{
output_plugin{}
}
Answer format: input_plugin,filter_plugin,output_plugin
We need to read the question carefully, so we can understand the process that the log needs to go through. First it says we want to get the comma-separated values from the command line. That says that your log information is coming from the command line to start. Then we are pulling the comma-seperated values from that information, which can be abbrievated csv. Now we have our filter. Lastly, we want to output back to the terminal. Meaning we are sending the results back to the terminal. The order of Operations should be stdin > csv > stdout. This information can be enough to glem the answer. But let’s dig a bit deeper.
For stdin and stdout, TryHackMe gives a nice example in the first configuration section. It explains what each of the plugin means. But if you want more information about them. TryHackMe also provides a link, I will as well: stdin & stdout
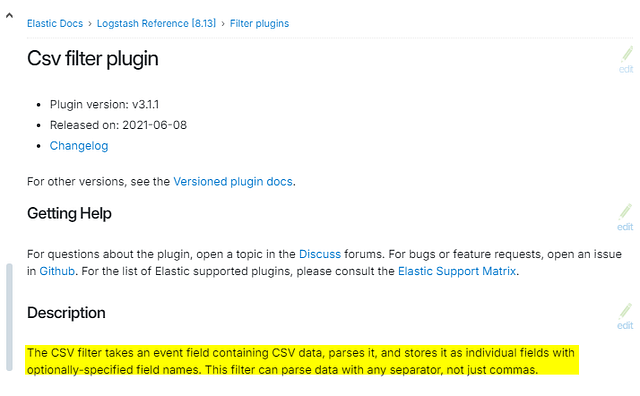
The only piece that is left is for the comma-seperated values or csv. You can find more information about it by going to the filter plugin page. Then use the find feature (ctrl+f ), and type csv. You will have 3 results, one of which should be in the Filter section. Click on it.
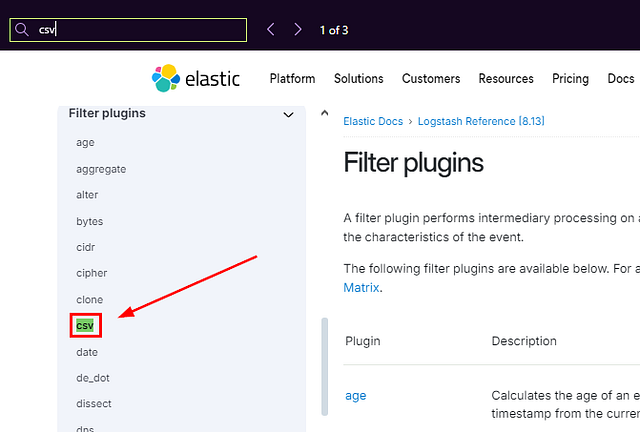
Reading through the Description, it looks like we found our Winner for the filter!!!
At this point you should have the answer, time to assemble it for TryHackMe. Remeber the format is input_plugin,filter_plugin,output_plugin. Taking the information we have gathered form the answer into the TryHackMe answer field. Then click Submit.

ANSWER: stdin,csv,stdout
Task 12 Excercise and Conclusion
A simple example is to examine the web-attack.csv file. We will write a configuration, apply a filter to add corresponding columns, and send the output to another file on the Desktop. The configuration file below shows an example of how to do this:
1
2
3
4
5
6
7
8
9
10
11
12
13
14
15
16
17
18
19
20
21
22
23
24
25
input {
  file {
    path => "/home/Desktop/web_attacks.csv"
    start_position => "beginning"
    sincedb_path => "/dev/null"
  }
}

filter {
  csv {
    separator => ","
    columns => ["timestamp", "ip_address", "request", "referrer", "user_agent", "attack_type"]
  }

  # Add any additional filters you need here

  # Example: Filter by specific attack types (optional)
  if [attack_type] =~ /SQL Injection|Brute Force/ {
    # Perform any necessary actions for the filtered logs
  }
}

output { file { path => /home/Desktop/updated-web-attacks.csv
  }
}
Conclusion
Well, that’s it from this room. It was an interesting topic to cover. Logstash helps us efficiently examine the logs after parsing and applying necessary filters, as we covered in the room. The topics we covered in this room are:
- How to install and configure ELK components.
- What are different input, filter, and output plugins available?
- Exploring the Logstash documentation.
- How to write simply to complex configurations.
There will be a next part of this room, where we will explore some realistic log sources and examine them in Kibana to visualize better and analyze them.
Let us know what you think about this room on our Discord channel or Twitter account. See you around.