This is a premium room on TryHackMe. It was created by TryHackMe and Mokmokmok. Here it the link to said room, TryHackMe Room — Tactical Detection
Establish a baseline knowledge of tactical detection, leveraging efficient techniques to bolster your security posture.

Task 1 Introduction
You’re hired as a security engineer, and you want to make a good impression. You noticed that there’s a default ruleset available, and it has already been enabled. The SOC team seems to function, albeit not as efficiently as you might expect — then it dawns on you; the default rules just won’t cut it.
This scenario is not uncommon — in fact, a common pitfall of modern SOCs today is leaning too much on default rules and settings of the products they deploy, leaving them with security alerts that don’t really add value to their security posture.
Learning Objectives:
In this room, we will strive to understand the mindset behind choosing a tactical approach in alerting and detecting threats, IOAs, IOCs, etc. In the process, we will gain practical experience in setting up a basic tactical detection capability leveraging techniques used in real-life environments.
Room Prerequisites and Expectation Setting:
There are no hard prerequisites in order to gain value from this room; however, it would be very helpful to have a basic understanding of navigating cmd and executing basic commands, as well as navigating FullEventLogView as it would be our main tool in reviewing Event Logs.
This room will touch upon some of the most efficient ways to bolster an organization’s security posture by leveraging detection mechanisms and walking the user through setting them up tactically. This should serve as a baseline where the user will be able to learn the basics, implement them in their functions, and make them truly their own.
Task 2 Unique Threat Intel
You stumbled upon documentation of a previous incident containing a couple of unique Indicators of Compromise (IOCs)
Unique IOCs of previous intrusions are good examples of Threat Intel as they’re traces of the specific adversary that your environment has already faced. The inclusion of these IOCs in your detection mechanism will help spot re-intrusion of that specific adversary immediately, among others.


The screenshots above are excerpts from a spreadsheet that contains IOCs that can be integrated with the organization’s current detection mechanism. It’s more or less the same format that Incident Responders use as they go through their investigation. Logging in IOCs in a file like this allows for better collaboration among multiple incident responders. It also makes scoping of the incident more effective — more often than not, IOCs lead to more IOCs.
In the spreadsheet excerpt above, based on the description, the direct indicator found by the authors of the documentation is actually just the bad3xe69connection[.]io; however, upon further inspection of the malicious domain, they were able to conclude that two other malicious domains should be recorded as IOCs due to their association with the original malicious domain.
To maximize our efficiency, we will transform these IOCs into detection rules in a vendor-agnostic format using Sigma.
Sigma is an open-source generic signature language developed to describe log events in a structured format. This allows for quick sharing of detection methods by security analysts.
A basic example of how it can be written into a functional Sigma rule is as follows.
1
2
3
4
5
6
7
8
9
10
11
12
13
14
15
16
17
18
19
20
21
22
title: Executable Download from Suspicious Domains
status: test
description: Detects download of executable types from hosts found in the IOC spreadsheet
author: Mokmokmok
date: 2022/08/23
modified: 2022/08/23
logsource:
  category: proxy
detection:
  selection:
    c-uri-extension:
      - 'exe'
    r-dns:
      - 'bad3xe69connection.io'
      - 'kind4bad.com'
      - 'nic3connection.io'
  condition: selection
fields:
  - c-uri
falsepositives:
  - Unkown
level: medium
The Sigma rule that we came up with from the IOCs presented above is very simple and straightforward, yet the additional layer of detection that it gives the organization is invaluable. In the grander scheme of things, these layers work together to give your analysts the visibility that they need to spot bad actors before it’s too late.
Remember that the bad guys need to circumvent all our defenses in order to get to their objectives, but we only need them to fail one layer of detection to have an idea that they’re there.
Answer the questions below
The answers can easily be found above, so I won’t share them below.
What did we use to transform IOCs as detection rules in a vendor-agnostic format?
Look for a single sentence above after the IOC screenshot. Read it and you’ll find your answer. Once you see it, type the answer into the TryHackMe answer field, and click Submit.

What is the original indicator found by the authors of the documentation? Write it as written in the spreadsheet.
Head up to the screenshots above. In the second screenshot, read the Description column. In the first one it states source. Source means orinator, which is what we are looking for. Look to the left under the DNS/IP Address column. This is where the answer is. Once you find it, type the answer into the TryHackMe answer field, and click Submit.

What is the full file path of the malicious file downloaded from the internet?
Moving up to the first screenshot this time, look under the Path column. Once you find it, type the answer into the TryHackMe answer field, and click Submit.

In the Sigma Rule baddomains.yml, what is the logsource category used by the author?
Take a look at the baddomains.yml output above. Parse down through till you see Logsource, under which you will find category. The string to the right is the answer. Once you find it, type the answer into the TryHackMe answer field, and click Submit.

Task 3 Publicly Generated IOCs
You’re feeling proud of yourself for being able to implement detection rules that have an immediate impact on the organization when suddenly, news broke out of a new 0-day vulnerability. Upon taking a closer look at it, you realize that your organization is directly susceptible to this vulnerability.
You don’t have to be able to experience everything in order to learn from something — you can learn from other people’s experiences or research or learnings. Analogous to that is the array of research being done by the community, and almost always, they release public IOCs. These public IOCs are then transformed into usable mechanisms to detect bad things in the environment.
Going back to our previous task, we’ve leveraged Sigma to transform unique IOCs into a product-agnostic form that we can use regardless of our SIEM choice. As this technique shows great promise to the community, there are a number of nice repositories that contain user-submitted Sigma rules that anyone can use. You can plug one directly into your SIEM for immediate value, or further edit it to fit your environment and add even more value to your security posture.
The following is a nice exercise: Write a detection rule for these two / transform these publicly generated IOCs into usable alerts for use in the Elastic Stack and Splunk. We will do the first one together, while you can do the rest on your own. For our purposes, we will be using Uncoder to help with the transformation of these sigma rules. Uncoder is a nice tool that helps convert sigma rules to queries that can be immediately used within a SIEM of your choice.
A fairly recent 0-day vulnerability, Follina-MSDT, has a publicly available sigma rule developed by huntress’s Matthew Brennan:
1
2
3
4
5
6
7
8
9
10
11
12
13
14
15
16
17
18
19
20
21
22
23
24
25
26
27
28
29
30
31
32
33
title: Suspicious msdt.exe execution - Office Exploit
id: 97a80ed7-1f3f-4d05-9ef4-65760e634f6b
status: experimental
description: This rule will monitor suspicious arguments passed to the msdt.exe process. These arguments are an indicator of recent Office/Msdt exploitation.
references:
    - https://doublepulsar.com/follina-a-microsoft-office-code-execution-vulnerability-1a47fce5629e
    - https://twitter.com/MalwareJake/status/1531019243411623939
author: 'Matthew Brennan'
tags:
    - attack.execution
logsource:
    category: process_creation
    product: windows
detection:

    selection1:
      Image|endswith:
        - 'msdt.exe'
    selection2:
      CommandLine|contains:
        - 'PCWDiagnostic'
    selection3:
      CommandLine|contains:
        - 'ms-msdt:-id'
        - 'ms-msdt:/id'

    selection4:
      CommandLine|contains:
        - 'invoke'
    condition: selection1 and (selection4 or (selection2 and selection3))
falsepositives:
  - Unknown
level: high
Another 0-day vulnerability that made waves this past year, log4j, has multiple publicly available sigma rules. One such rule can detect suspicious shells spawned from a Java host process, written by Andreas Hunkeler and Florian Roth:
1
2
3
4
5
6
7
8
9
10
11
12
13
14
15
16
17
18
19
20
21
22
23
24
25
26
27
28
29
30
31
32
33
34
35
36
37
38
39
40
41
42
43
44
title: Suspicious Shells Spawned by Java
id: 0d34ed8b-1c12-4ff2-828c-16fc860b766d
description: Detects suspicious shell spawned from Java host process (e.g. log4j exploitation)
status: experimental
author: Andreas Hunkeler (@Karneades), Florian Roth
date: 2021/12/17
modified: 2022/08/02
tags:
    - attack.initial_access
    - attack.persistence
    - attack.privilege_escalation
logsource:
    category: process_creation
    product: windows
detection:
    selection:
        ParentImage|endswith: '\java.exe'
        Image|endswith:
            - '\sh.exe'
            - '\bash.exe'
            - '\powershell.exe'
            - '\pwsh.exe'
            - '\schtasks.exe'
            - '\certutil.exe'
            - '\whoami.exe'
            - '\bitsadmin.exe'
            - '\wscript.exe'
            - '\cscript.exe'
            - '\scrcons.exe'
            - '\regsvr32.exe'
            - '\hh.exe'
            - '\wmic.exe'        # https://app.any.run/tasks/c903e9c8-0350-440c-8688-3881b556b8e0/
            - '\mshta.exe'
            - '\rundll32.exe'
            - '\forfiles.exe'
            - '\scriptrunner.exe'
            - '\mftrace.exe'
            - '\AppVLP.exe'
            - '\curl.exe'
    condition: selection
falsepositives:
    - Legitimate calls to system binaries
    - Company specific internal usage
level: high
Upon navigating to Uncoder, you will immediately see two text boxes, as shown below:

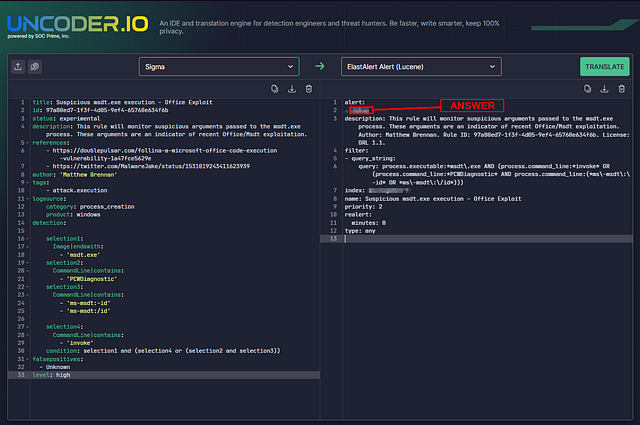
Make sure that on the left side, the Sigma tab is selected as shown above. Copy the Follina-MSDT Sigma Rule contents and then paste it in the left text box. Click on the downward arrow and select ElastAlert. Click on the Translate button when you’re ready.
Upon clicking Translate, it shouldn’t take long before the results come out of the right text box.
It is important to note that there’s no guarantee that the transformed Sigma rules will work perfectly straight out of Uncoder. In order to be production ready, you need to do a lot of testing and fine-tuning. What Uncoder essentially offers is a generic blueprint — it is up to the user to further improve upon it.
Answer the questions below
Upon translating the Follina Sigma Rule, what is the index name that the rule will be using, as shown in the output?
We need to start by going to Uncoder, which should already be done if you followed the above instructions. Once there, we need to choose the first platform it comes from, in our case it is Sigma. On the Select Platform drop down on the left, click on the down caret to the right. Then click on Sigma.

Now on the Select Platform on the right. Click the down caret, then click on ElastAlert. The reason we are choosing ElastAlert is from the text above: Write a detection rule for these two / transform these publicly generated IOCs into usable alerts for use in the Elastic Stack and Splunk.

Heading back to the THM page, we need to copy the Follina-MSDT Sigma Rule. So higlight and copy the rule. Then go back to Uncoder.io and paste it in the input box on the left of the screen. Now click the button in the upper right that is teal and labeled TRANSLATE.

The Output on the right will be the generated ElastAlert detection alert you can use in Elastic. The question asked us what the index name is in the ElastAlert. This can be found by parsing through the alert until you find the label index:. Once you have found it, the answer is to the right. Type the answer into the THM answer field, then click Submit.

ANSWER: winlogbeat-*
What is the Alerter subclass, as shown in the output?
Heading back over to Uncoder.io, we need to parse through the output again. This time looking for alert. Once you find it, the subclass is right below it. Type the answer into the THM answer field, then click Submit.
ANSWER: debug
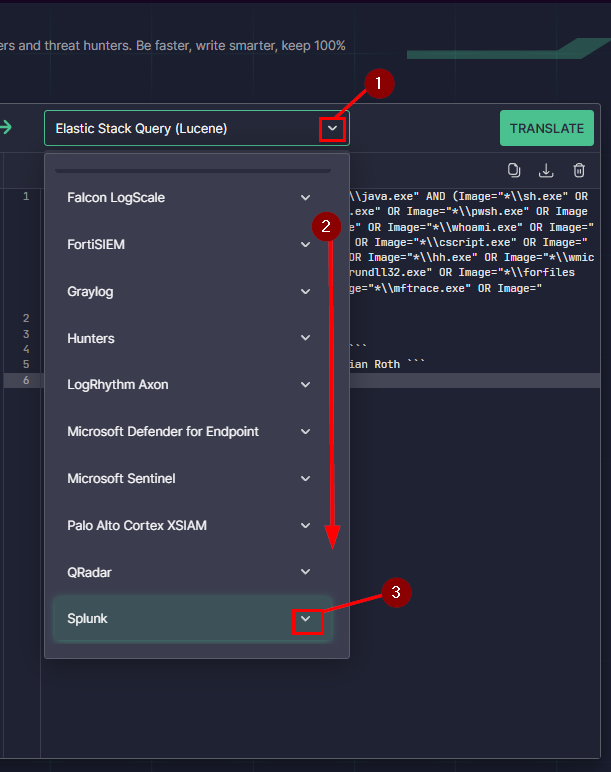
Change the Uncoder output to Elastic Stack Query (Lucene).
Using the Select Platform drop down on the right. Click the down caret. Then choose Elastic Stack, then click the teal TRANSLATE button in the top right. Your all set to answer the next question.

Which part of the ElastAlert output looks exactly like the Elastic Query?
If you need to you can switch between ElastAlert and Elastic Stack. To easliy compare the two. The top section of the alert is what we are looking for, because everything with a //is a comment. Let’s look at the ElastAlert now.

Comparing the two, it is pretty obvious where the similarity is at. Following the syntax, look when there is no indent into the alert. There you will find the answer, once you do type it into the THM answer field. Then click Submit.

ANSWER: filter
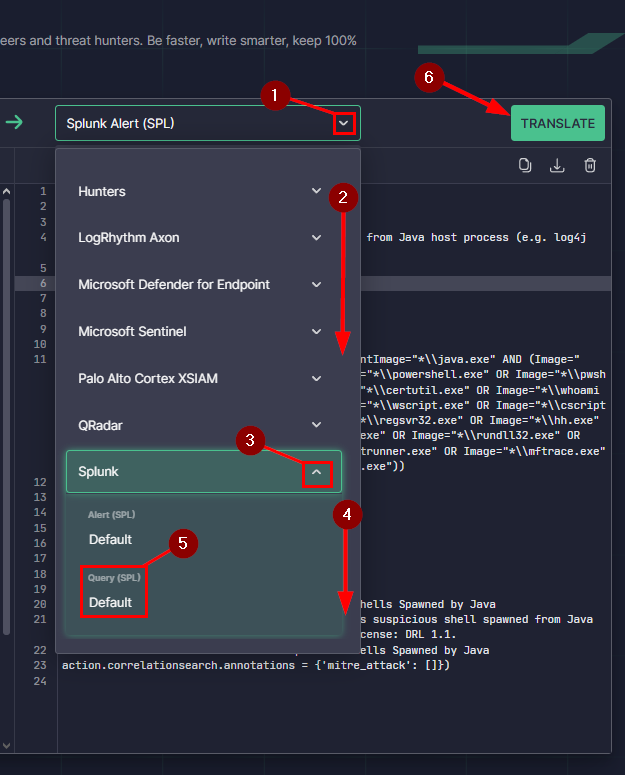
Translate the Log4j Sigma Rule into a Splunk Alert (SPL).
We need to first remove the old Sigma rule from the input field. To do this you will click on the garbage can icon at the top right of the input field.

Heading back to THM you need to copy the Log4j Suspicious Shells Sigma Rule. Once you’ve done this, head back over to Uncoder.io and paste it into the input section on the left.

Moving to the Select Platform drop down on the right. Click the down caret, then scroll down to the bottom of the drop down menu. At the bottom you will see Splunk, to the right is another down caret. Click on it.
A drop down will appear but you need to scroll down a bit more. We can now see two new options. We want to click on the Alert (SPL). Now click on the teal TRANSLATE button in the top right of the output box. You are all set to answer the next question.

What is the alert severity, as shown in the output?
Let’s parse through the output for alert severity. It is a pretty easy find for this question. Once you find it, type the anwer into the THM answer field. Then click Submit.

ANSWER: 3
What is the dispatch.earliest_time value, as shown in the output?
Again, we need to parse through the output again. This time we are searching for dispatch.earliest_time. Once we find it, copy and then paste the answer into the THM answer field. Then click Submit.

ANSWER: -60m@m
Change the Uncoder output to Splunk Query (SPL).
At this point we are becoming pros at this. So again, let’s click the down caret in the Select Platform for the output. Scroll down to the bottom and click on the down caret for Splunk. Scroll down a bit more, then this time click on Query (SPL). To finish it off, click the teal TRANSLATE button in the top right of the output box. Let’s answer the final question in this task.
What is the source, as shown in the output?
Parsing through the output this time, we can see that source is the first word. Meaning we won’t have to look far for the answer. Which is what comes after the = and before the first AND. Once you see it, copy and paste the answer into the THM answer field. Then click Submit.

ANSWER: WinEventLog:Security
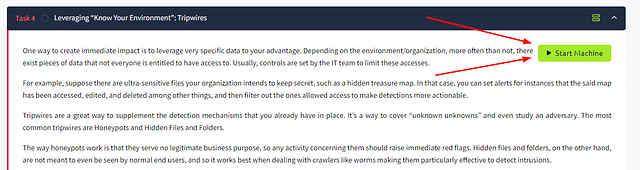
Task 4 Leveraging “Know Your Environment”: Tripwires
One way to create immediate impact is to leverage very specific data to your advantage. Depending on the environment/organization, more often than not, there exist pieces of data that not everyone is entitled to have access to. Usually, controls are set by the IT team to limit these accesses.
For example, suppose there are ultra-sensitive files your organization intends to keep secret, such as a hidden treasure map. In that case, you can set alerts for instances that the said map has been accessed, edited, and deleted among other things, and then filter out the ones allowed access to make detections more actionable.
Tripwires are a great way to supplement the detection mechanisms that you already have in place. It’s a way to cover “unknown unknowns” and even study an adversary. The most common tripwires are Honeypots and Hidden Files and Folders.
The way honeypots work is that they serve no legitimate business purpose, so any activity concerning them should raise immediate red flags. Hidden files and folders, on the other hand, are not meant to even be seen by normal end users, and so it works best when dealing with crawlers like worms making them particularly effective to detect intrusions.
Setting up a Basic Tripwire:
Click on the Start Machine button at the top right corner of this task.
The machine will be available on your web browser, in split-screen view. In case the VM is not visible, use the blue Show Split View button at the top-right of the page.

You may use the following credentials if you prefer accessing the machine via RDP:
Machine IP: MACHINE_IP
User: Administrator
Password: Follina_0438
Once the machine has initiated, click on the start icon and type “Local”. The Local Security Policy application should appear. Open the application, then navigate to Security Settings → Local Policies → Audit Policy.

Open the Audit object access policy, tick the boxes beside Success and Failure, click Apply, and finally click OK. This entails that all access attempts will be logged, regardless of whether it succeeded. Once you’re done, you may proceed to close the Local Security Policy application.
After configuring the Local Security Policy, nothing new will immediately happen by default. We have to specify in the actual file or folder that we intend to monitor it and as such, for our purposes, we will create a fresh file wherein our tripwire setup can be implemented and consequently observed. Right-click anywhere on the desktop → New → Text Document. A new unnamed text file will appear on the Desktop, and we can name it “Secret Document”. Right-click the document → Properties → Security → Advanced → Auditing.
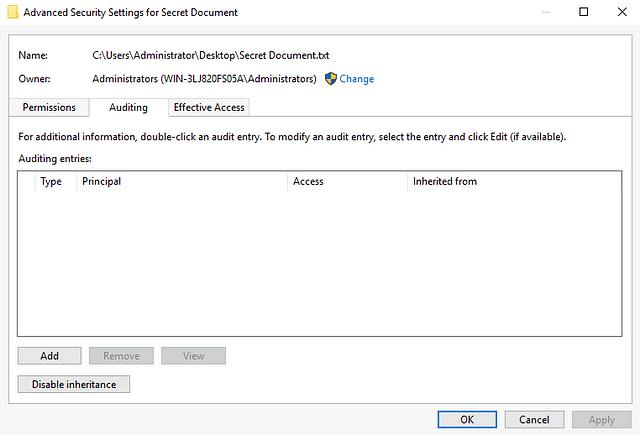
This is where we will create and specify an audit entry for our Secret Document. Click on Add → Select a principal.
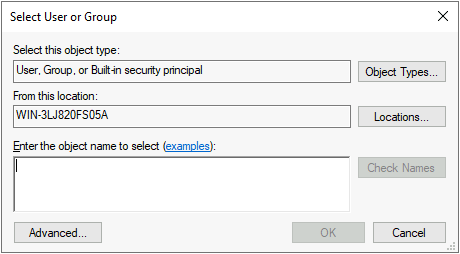
This particular pop-up is where we can specify which users or groups we want to be alerted on whenever they access our Secret Document. You have a choice to be very granular, but for our purposes, we intend to be general and so, on the text box, write “Everyone”, then press Enter.
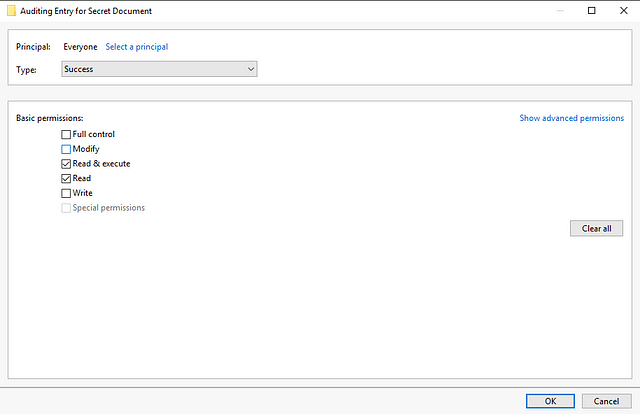
The Principal should now reflect “Everyone” and the permissions should now allow granular selection. Here you can specify all the activities on our Secret Document you want to audit. You can toggle to the advanced permissions via the Show advanced permissions on the upper right-hand corner of the area for an even broader selection of activities. Click OK when you’re done exploring, and then click Apply and OK on the Audit entry page. Finally, we click on OK on our Secret Document properties.
An important note here is if you intend to track multiple files, it is recommended to have them categorized into folders so as to make it easier to audit their access.
At this point, the setup is complete and auditing is active for our Secret Document. Anyone who accesses it will be logged and its details will be recorded in the Security event log with an Event ID 4663. This Event ID, along with the other Object Access Event IDs, can then be filtered and furnished into alerts that would immediately tell your analysts of tripwires being activated, immediately giving value to the organization’s security.
More info about Object Access Events, and the Audit Object access in general can be read here.
Answer the questions below
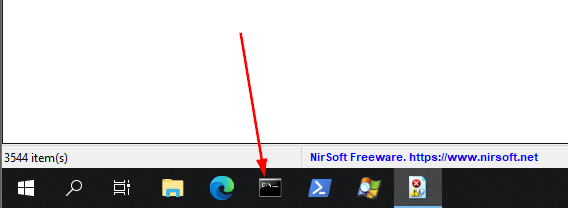
The FullEventLogView application comes installed on your Windows machine. Use it for the following questions.
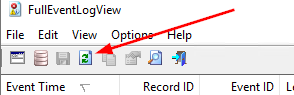
THM has the icon for the FullEventLogView on the taskbar. It is the last icon on the right of the taskbar. Click on it to open it.

Give the application a moment, but it will open and load the event logs.

What is the “Accesses” value in the log details when you try reading our Secret Document’s contents via cmd?
Looking back to the taskbar, we want to start of by click on the Terminal icon. This will open the terminal to work via the command line.
The terminal opens in the location of C:\Users\Administrator. Since the document is on the Desktop, we need to move over there. To do this using the command cd Desktop, and press enter to run.
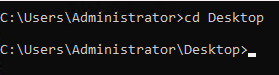
To open our document, we can start to type it Sec. Then press tab, to tab complete the rest of the input for "Secret Document.txt" and press enter. A Notepad window will pop-up on the screen.

Heading back to FullEventLogView, click on the refresh icon in the icon bar of FullEventLogView. This will bring all the most recent logs into view.
One thing we know is that from what we have done so far, it would have been an Audit. Which can be seen in the Keywords column with Audit Success. Looking at the first instance of this, click on it so that more information will be provided about this alert in the below section.

As I mentioned, the bottom section is more details pertaining to the alert. Scroll down in the alert details till see Accesses. The value of this field is below SYNCHRONIZE. Once you find it, copy and paste or type the answer into the THM answer field. Then click Submit.

ANSWER: ReadData (or ListDirectory)
Event ID 4663 is always preceded by?
Looking back up in the Event ID’s column, we spot event 4663. Since preceded means before. We can deduce that the Event we were just working on is the Event ID the always comes before event 4663. Type this Event ID into the THM answer field, then click Submit.
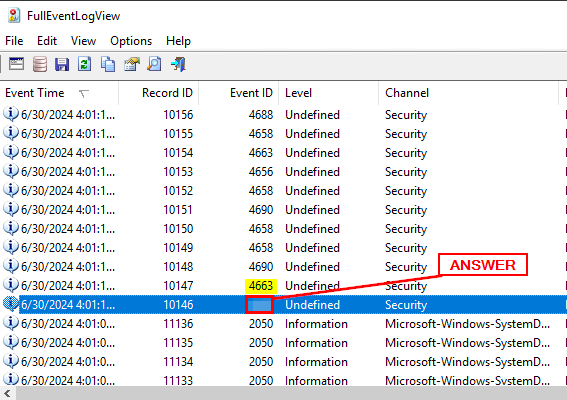
ANSWER: 4656
What Event ID signifies the closure of an “object”?
The easiest way to answer this is to parse through the Description column. Several desriptions indicate the following: The handle to an object was closed. Which is what we are looking for in this questions. So sliding to the left till we hit the Event ID’_s column, which is where we will get our answer. Once you find it type the answer into the THM answer field. Then click _Submit.
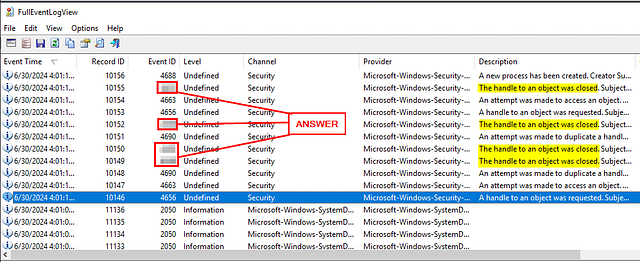
ANSWER: 4658
Event ID 4658 helps determine how long a specific object was open. What description field will you check in between events to be able to do so?
To find this answer you need to look in the bottom alert detail section. As we can see under the Object field it has the name which indicates the current working directory with the file name. But this can change or not even be present. But under that, is the field we are looking for, as the hex value will be present in other alerts. So that you can track it better. Once you find it, type the answer into the THM answer field. Then click Submit.

ANSWER: Handle ID
Task 5 Purple Teaming
To cap this room off is a quick lesson on one of the best ways to strengthen an organization’s overall security posture — by leveraging purple team tactics. A couple of rooms that showcase purple teaming are the Tempest and Follina (CVE-2022–30190) rooms.
The idea is simple: if you want to see how your defenses fare against an attack, understand how a certain vulnerability works and what it looks like on the logs, or you simply want to know the extent of your visibility on your environment — simulate an attack and then check the results.
Consequently, reflect on the following questions:
- What are the attacker techniques that you did?
- Which ones did you detect?
- Which ones flew under the radar?
The ones that you detected will affirm that you’re doing a good job in those areas, whereas the ones you failed to detect constitute improvements that are ought to be made in your visibility and/or detection mechanisms.
Quick Discussion for Tempest:
For the Tempest room, the room creator designed a full attack chain and emulated an adversary from start to finish, collecting valuable logs and showcasing detection and analysis tools as the room progresses. This is a classic example of the application of purple team tactics. The goal is to understand how logs will look like when specific attack techniques are being implemented against your environment.
Quick Discussion for Follina MSDT:
From the Follina MSDT room, the room creator focused on the effects of the exploitation of the vulnerability in the environment and introduced how reviewing logs and process artifacts compliments publicly available IOCs.
From these findings, you can furnish alerts from the artifacts you’ve collected as well as from findings that you’re able to observe via your logging mechanisms. These are just a couple of ways to leverage purple team tactics, and both show emphasis on how effective it is when leveraged well.
Answer the questions below
This answer can easily be found above, so I won’t share it here. Just where to look.
Fill in the Blanks: The Tempest and Follina rooms are examples of leveraging __ __ tactics.
You are able to find this in the first paragraph above. Read through it. Once you find the answer, type it into the THM answer field, then click Submit.

What CVE is the Follina MSDT room about?
Answer Format: CVE-XXXX-XXXXX
Again, you can easily find this in the first paragraph. Read through it. Once you find the answer, type it into the THM answer field, then click Submit.

Task 6 Room Recap
This room explored some of the simplest ways that an organization can leverage immediately available information, “knowing your environment”, and purple team tactics to develop a more robust detection mechanism — one that is more suited for each unique environment. In a world of purchase-deploy-and-forget, these tactics aim to provide an additional layer of security that would immediately be of value to wherever they are applied.
This room has also emphasized the value of layering defenses. It is never a good idea to put all your eggs in one basket in the same way that an organization shouldn’t put all their time, money, and reputation on the shoulders of one method of detection and/or prevention. No method is perfect, so having depth in these defensive methods would allow for more opportunities to catch the bad guys.
Finally, a couple of rooms that leverage purple team tactics have been the chosen method of closing this topic.