Task 1 Introduction
In this room, we will cover the fundamentals of packet analysis with Wireshark and investigate the event of interest at the packet-level. Note that this is the second room of the Wireshark room trio, and it is suggested to visit the first room (Wireshark: The Basics) to practice and refresh your Wireshark skills before starting this one.
In the first room, we covered the basics of the Wireshark by focusing on how it operates and how to use it to investigate traffic captures. In this room, we will cover advanced features of the Wireshark by focusing on packet-level details with Wireshark statistics, filters, operators and functions.
Note: A VM is attached to this room. You don’t need SSH or RDP; the room provides a “Split View” feature. Access to the machine will be provided in-browser and will deploy in Split View mode in your browser. If you don’t see it, use the blue Show Split View button at the top right of this room page to show it. DO NOT directly interact with any domains and IP addresses in this room. The domains and IP addresses are included for reference reasons only.
Getting the VM Started
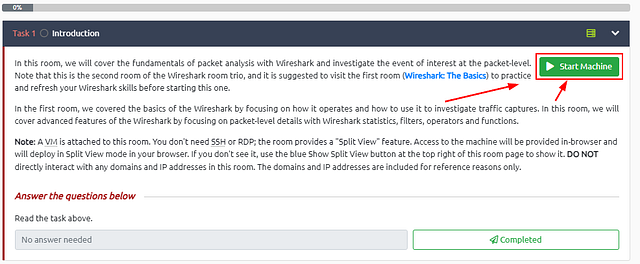
Starting at Task 1, you will see the green Start Machine button. Click this button to get the VM Started.
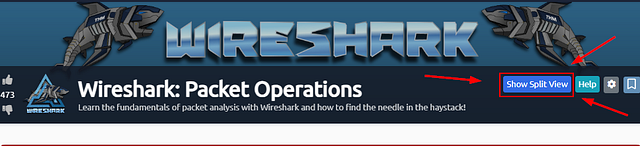
Scroll to the top where the banner is. On the right side of the page, you will see the blue Show Split view. Click this blue button.
The page will split, now just wait till the VM loads.
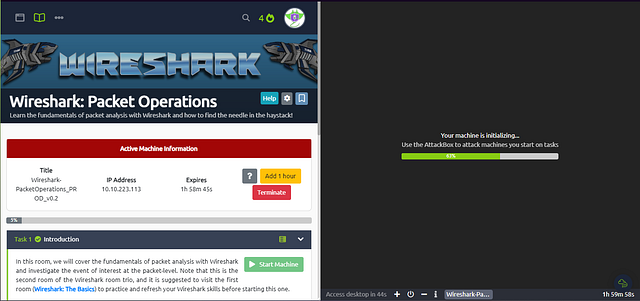
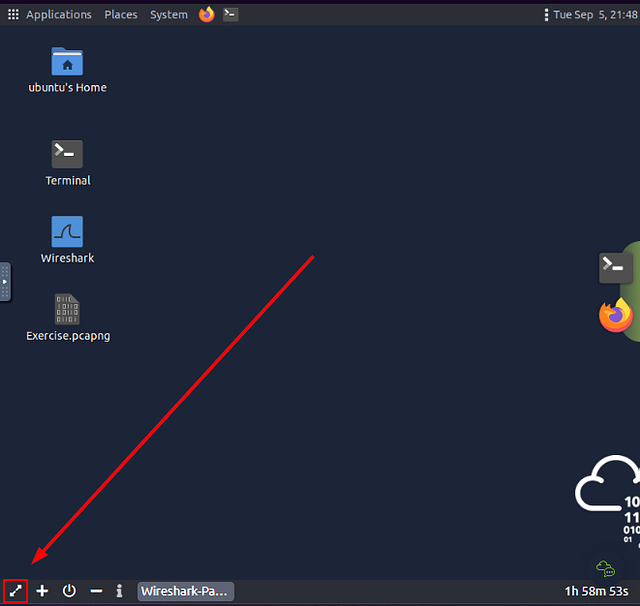
Once the VM loads, click the View in Full Screen icon in the bottom left of the VM.
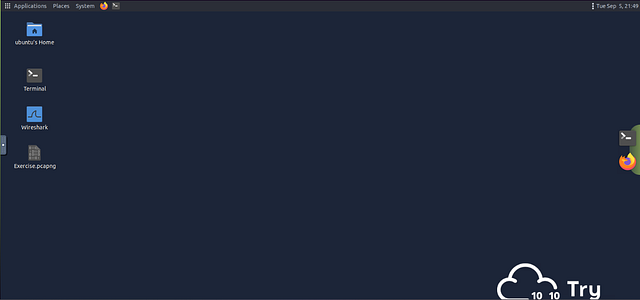
A new browser tab should open with the VM in it.
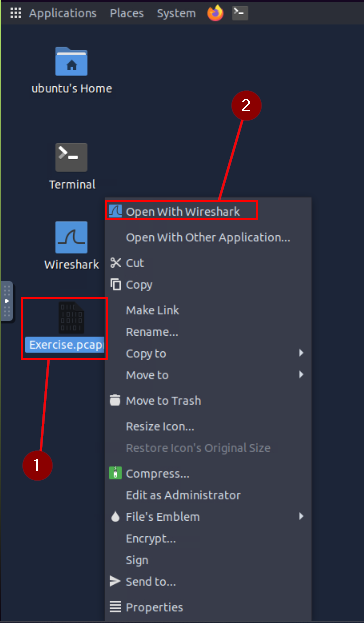
Right-click on Exercise.pcapng, then on the drop-down menu click the Open With Wireshark.
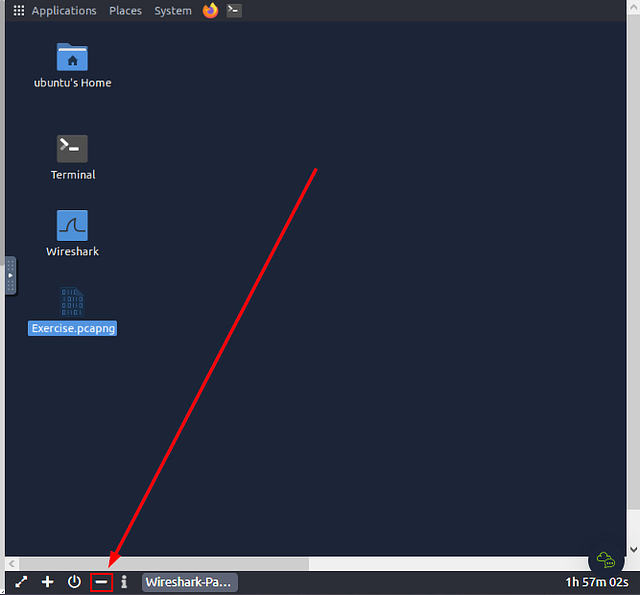
While Wireshark loads, head back to the THM Task Tab. At the bottom of the VM you will see a minus ( — ), this represents Exit Split View. Click the — to allow the THM task to incapsilate the entire window. This won’t close out of your VM instance, it will just be on the other tab.
Now head back to the broswer tab that the VM instance is in. Wireshark should be open and ready to use.
Task 2 Statistics | Summary
Statistics
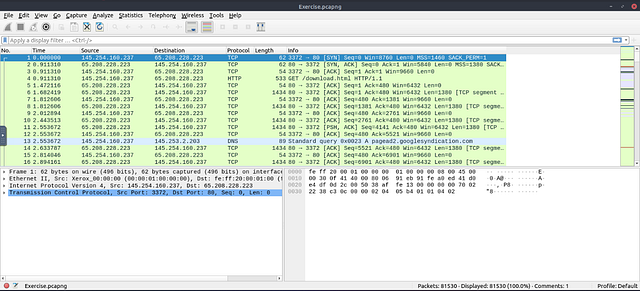
This menu provides multiple statistics options ready to investigate to help users see the big picture in terms of the scope of the traffic, available protocols, endpoints and conversations, and some protocol-specific details like DHCP, DNS and HTTP/2. For a security analyst, it is crucial to know how to utilise the statical information. This section provides a quick summary of the processed pcap, which will help analysts create a hypothesis for an investigation. You can use the “Statistics” menu to view all available options. Now start the given VM, open the Wireshark, load the “Exercise.pcapng” file and go through the walkthrough.
Resolved Addresses
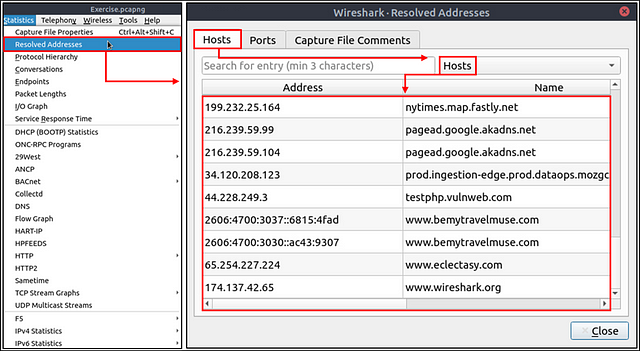
This option helps analysts identify IP addresses and DNS names available in the capture file by providing the list of the resolved addresses and their hostnames. Note that the hostname information is taken from DNS answers in the capture file. Analysts can quickly identify the accessed resources by using this menu. Thus they can spot accessed resources and evaluate them according to the event of interest. You can use the “Statistics → Resolved Addresses” menu to view all resolved addresses by Wireshark.
Protocol Hierarchy
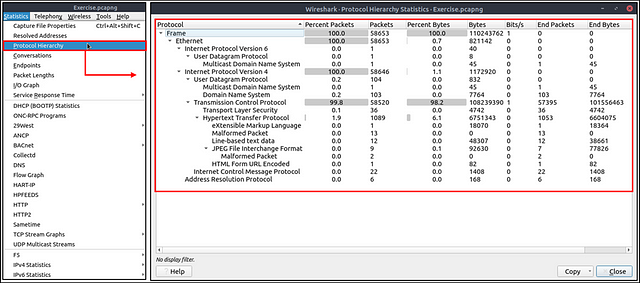
This option breaks down all available protocols from the capture file and helps analysts view the protocols in a tree view based on packet counters and percentages. Thus analysts can view the overall usage of the ports and services and focus on the event of interest. The golden rule mentioned in the previous room is valid in this section; you can right-click and filter the event of interest. You can use the “Statistics → Protocol Hierarchy” menu to view this info.
Conversations
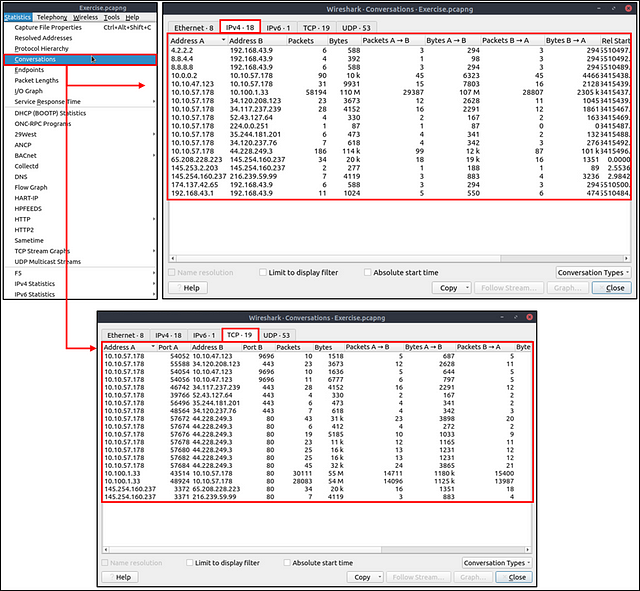
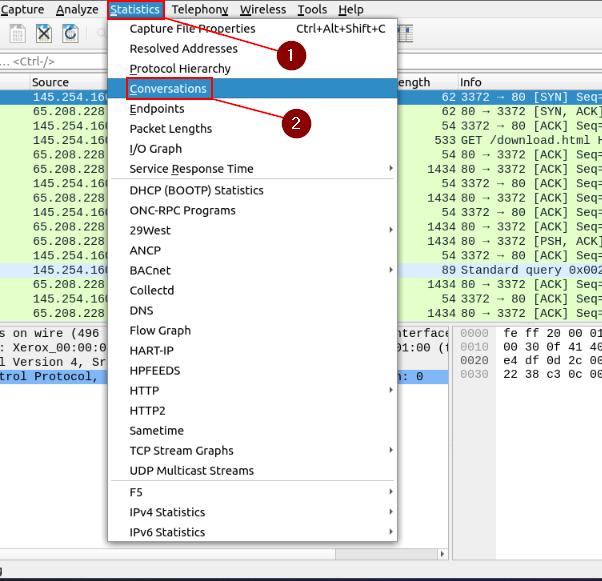
Conversation represents traffic between two specific endpoints. This option provides the list of the conversations in five base formats; ethernet, IPv4, IPv6, TCP and UDP. Thus analysts can identify all conversations and contact endpoints for the event of interest. You can use the “Statistic → Conversations” menu to view this info.
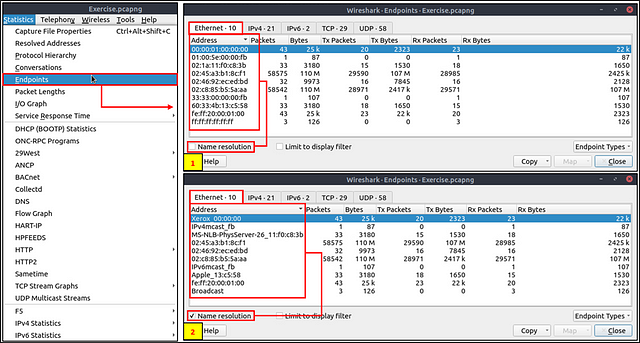
Endpoints
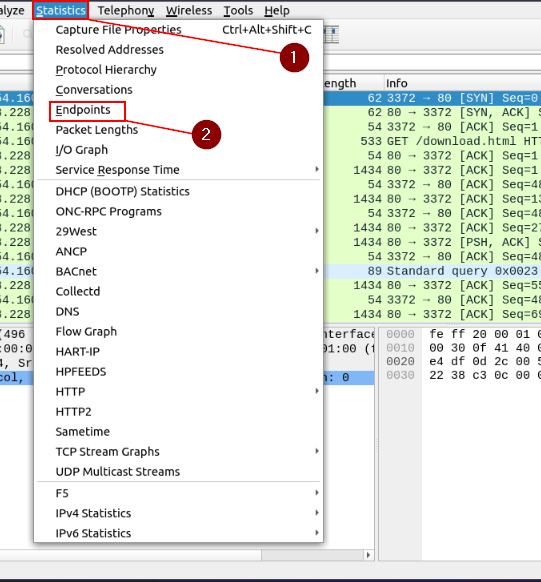
The endpoints option is similar to the conversations option. The only difference is that this option provides unique information for a single information field (Ethernet, IPv4, IPv6, TCP and UDP ). Thus analysts can identify the unique endpoints in the capture file and use it for the event of interest. You can use the “Statistics → Endpoints” menu to view this info.
Wireshark also supports resolving MAC addresses to human-readable format using the manufacturer name assigned by IEEE. Note that this conversion is done through the first three bytes of the MAC address and only works for the known manufacturers. When you review the ethernet endpoints, you can activate this option with the “Name resolution” button in the lower-left corner of the endpoints window.
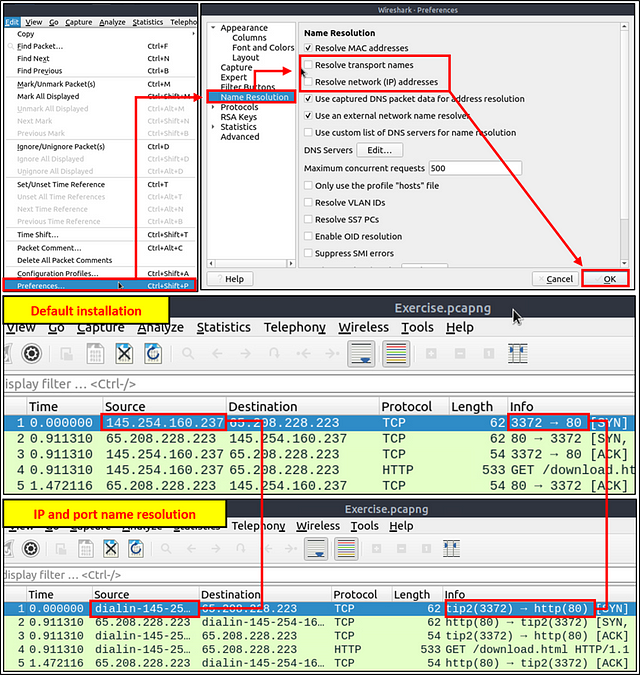
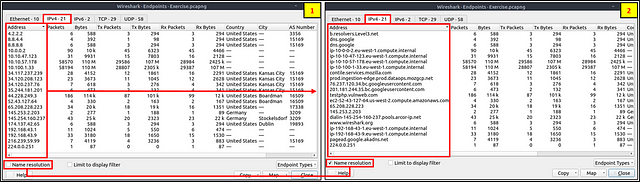
Name resolution is not limited only to MAC addresses. Wireshark provides IP and port name resolution options as well. However, these options are not enabled by default. If you want to use these functionalities, you need to activate them through the “Edit → Preferences → Name Resolution” menu. Once you enable IP and port name resolution, you will see the resolved IP address and port names in the packet list pane and also will be able to view resolved names in the “Conversations” and “Endpoints” menus as well.
Endpoint menu view with name resolution:
Besides name resolution, Wireshark also provides an IP geolocation mapping that helps analysts identify the map’s source and destination addresses. But this feature is not activated by default and needs supplementary data like the GeoIP database. Currently, Wireshark supports MaxMind databases, and the latest versions of the Wireshark come configured MaxMind DB resolver. However, you still need MaxMind DB files and provide the database path to Wireshark by using the “Edit → Preferences → Name Resolution → MaxMind database directories” menu. Once you download and indicate the path, Wireshark will automatically provide GeoIP information under the IP protocol details for the matched IP addresses.
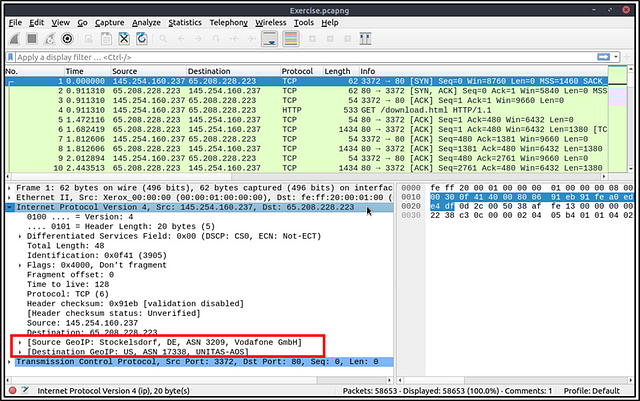
Endpoints and GeoIP view.
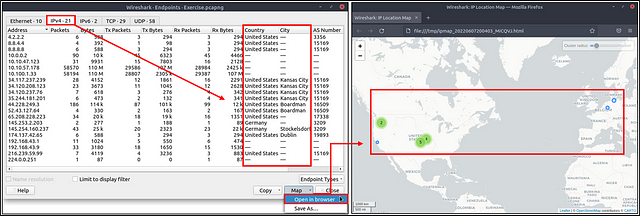
Note: You need an active internet connection to view the GeoIP map. The lab machine doesn’t have an active internet connection!
Answer the questions below
Investigate the resolved addresses. What is the IP address of the hostname starts with “bbc”?
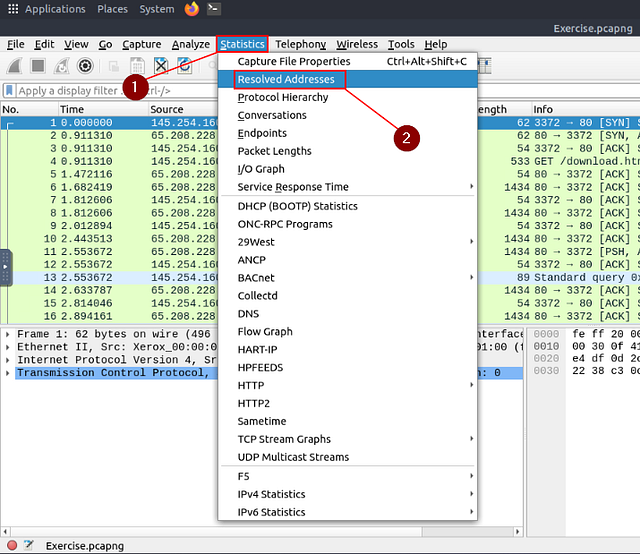
At the top of the Wireshark window, click on Statistics from the menu bar. In the drop-down, click on Resolved Addresses.
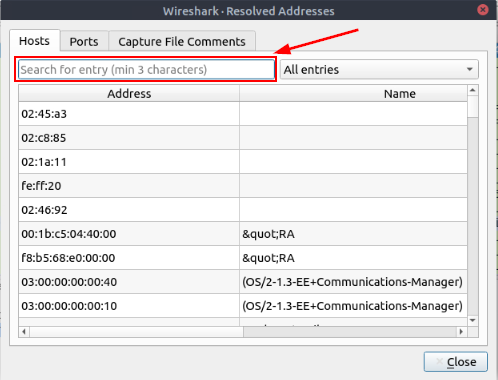
The Wireshark — Resolved Addresses window will pop-up. At the top of this window is a search field labeled Search for entry (min 3 characters). Type bbc into this search field.
After you have typed bbc into the search field. It will auto filter any matches. There should be only one Hostname that matches to the query. The address that was resolved from this Hostname is the answer to the question. You can click on the IP Address, and use copy (CTRL+C). Then paste (CTRL+V) the answer into the THM answer field, and click submit.
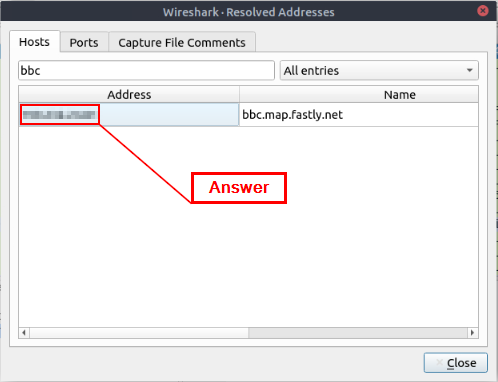
Answer: 199.232.24.81
What is the number of IPv4 conversations?
Go back up to the Menu bar and click Statistics again. This time click on the Conversations option from the drop-down menu.
The Conversations window will pop-up. You can see the different tabs at the top of this window. The tab that pertains to this question is the IPv4 tab. Look at the number on this tab, this is the answer to this question. Type it into the answer field on THM, and then click submit.
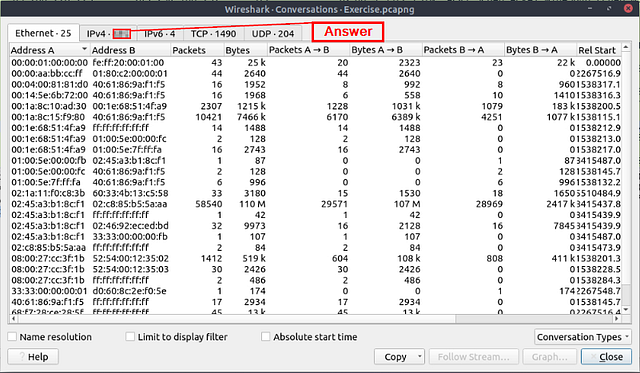
Answer: 435
How many bytes (k) were transferred from the “Micro-St” MAC address?
Once again, head back up to the menu bar and click Statistics. On the drop-down menu click Endpoints.
The Endpoints window will pop-up. Look at the bottom left of the window. Click the checkbox next to Name Resolution.
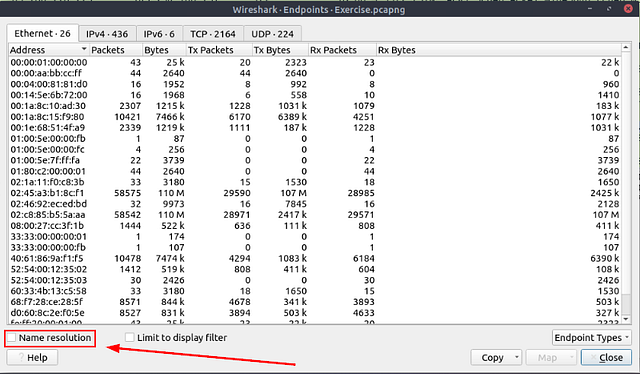
After checking the Name Resolution checkbox, the MAC address will now display the resolved Name. Looking down through the list, you need to find the name Micro-St. Once you find it look across the row till you get to the Bytes column, displaying the amount of Bytes that were transferred from that Name/MAC Address. Once you have found the answer, type it into the THM answer field, then click submit.
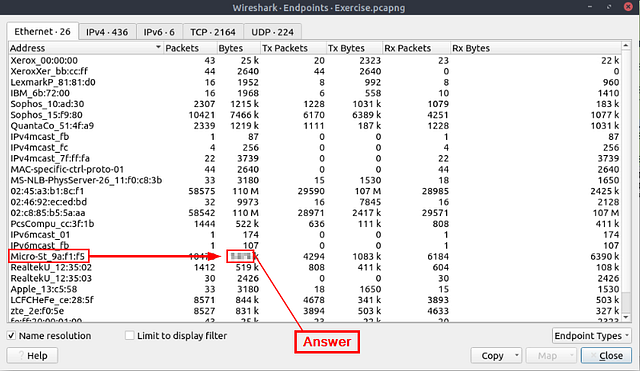
Answer: 7474
What is the number of IP addresses linked with “Kansas City”?
You are going to stick with the Endpoints window for this question. Going back to it, you will want to click on the tab labeled IPv4.
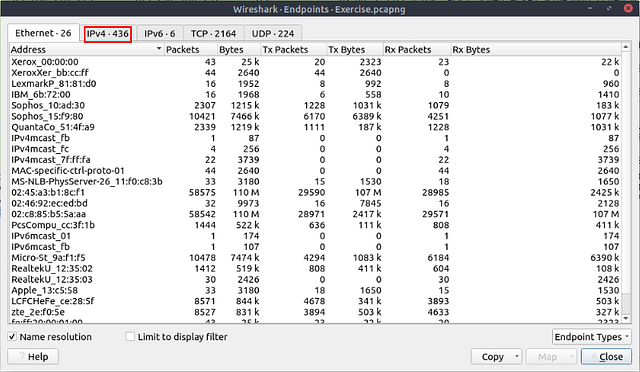
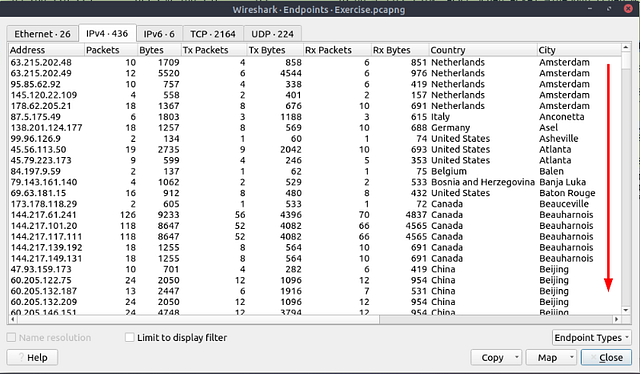
You will now be presented with the IPv4 Endpoints from the pcapng file in the table format. Look for the column labeled City, and click on it to alphabitize them.
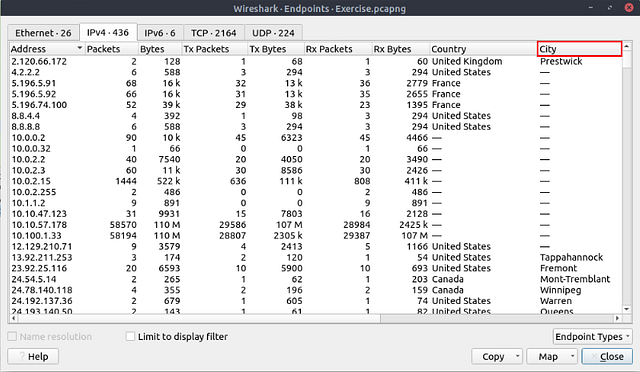
Scroll down till you find Kansas City.
Once you have found it, count the number of times it appears and you will have your answer. Type your answer into the THM answer field, and then click submit.
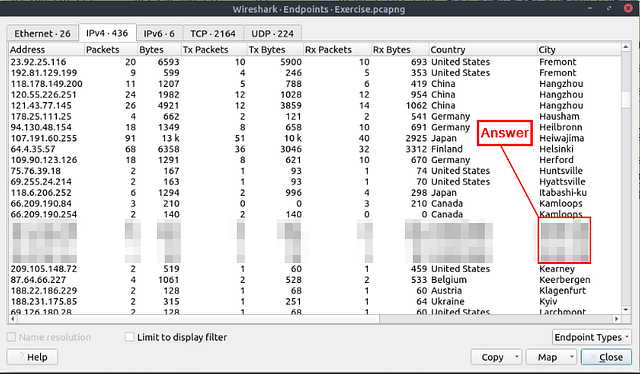
Answer: 4
Which IP address is linked with “Blicnet” AS Organisation?
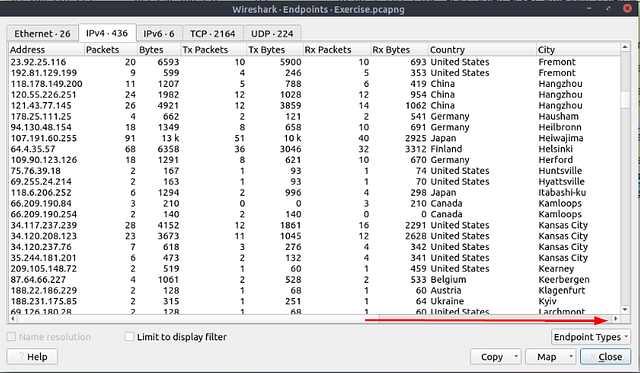
One last time, head back to the Endpoints window. This time you are going to want to scroll to the right until you see the column As Organization.
Like before, when you find the column As Organization. Click on it to alphabatize it.
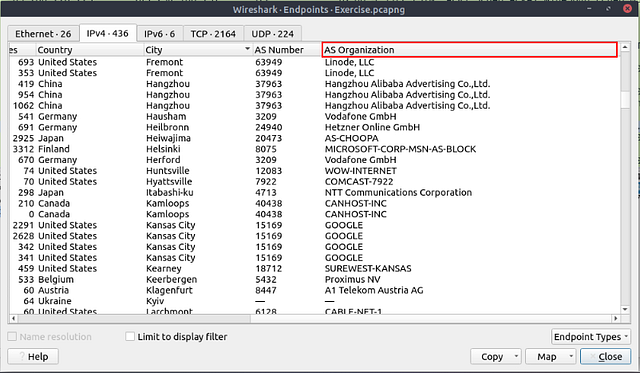
Scroll up till you see Blicnet in the As Organization column.
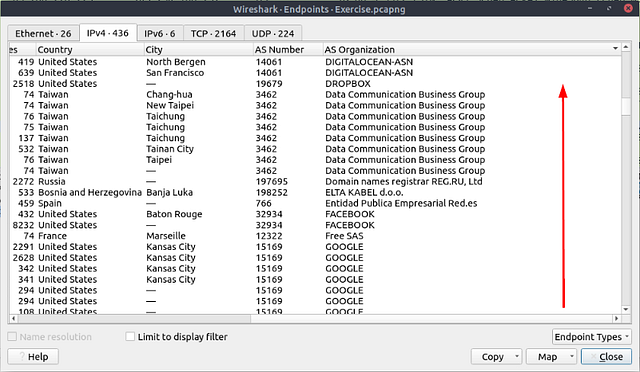
When you find it, click on the row to highlight it. Then scroll to the left till you see the Address column.
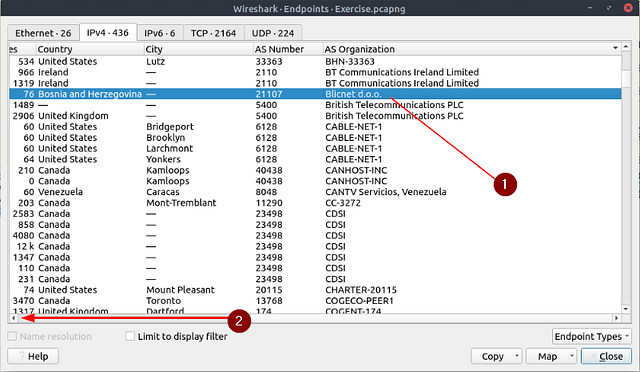
Once you reach the Address column, you will see the IPv4 address associated with Blicnet and thus the answer. Type it into the THM answer field, and then click submit.
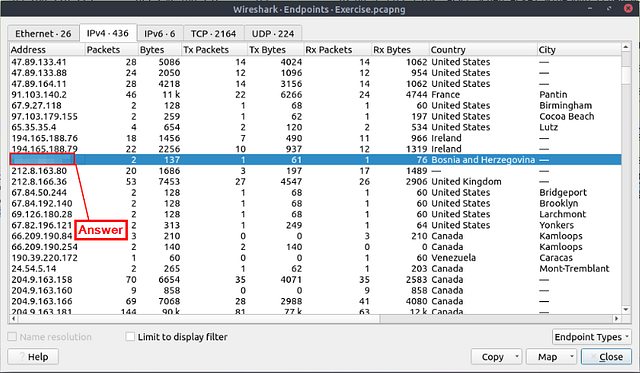
Answer: 188.246.82.7
You have finished these tasks and can now move on to Task 3 Statistics-Protocol Details, Task 4 Packet Filtering-Principles, & Task 5 Packet Filtering-Protocol Filters.