If you haven’t done tasks 1 & 2 yet, here is the link to my write-up of them: Task 1 Introduction & Task 2 Statistics-Summary
Getting the VM Started
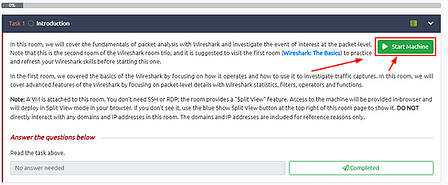
Starting at Task 1, you will see the green Start Machine button. Click this button to get the VM Started.
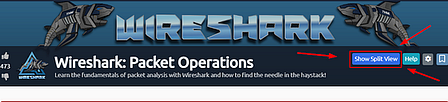
Scroll to the top where the banner is. On the right side of the page, you will see the blue Show Split view. Click this blue button.
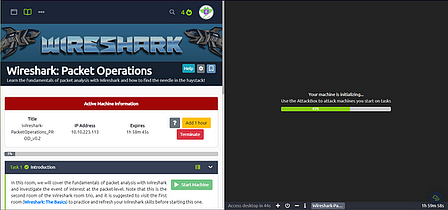
The page will split, now just wait till the VM loads.
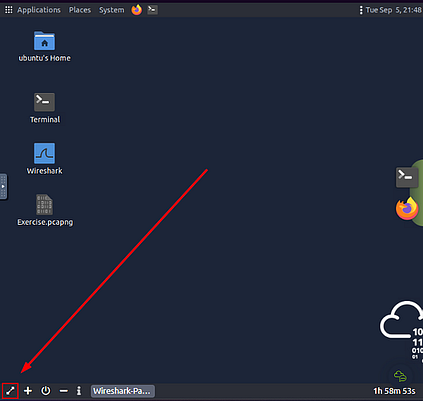
Once the VM loads, click the View in Full Screen icon in the bottom left of the VM.
A new browser tab should open with the VM in it.
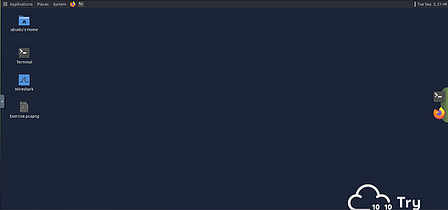
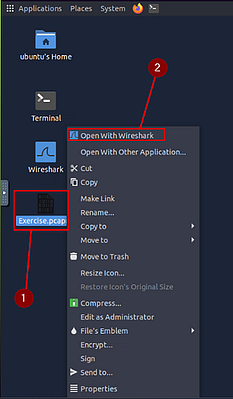
Right-click on Exercise.pcapng, then on the drop-down menu click the Open With Wireshark.
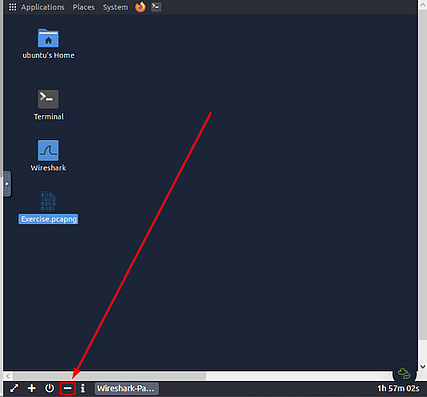
While Wireshark loads, head back to the THM Task Tab. At the bottom of the VM you will see a minus ( — ), this represents Exit Split View. Click the — to allow the THM task to incapsilate the entire window. This won’t close out of your VM instance, it will just be on the other tab.
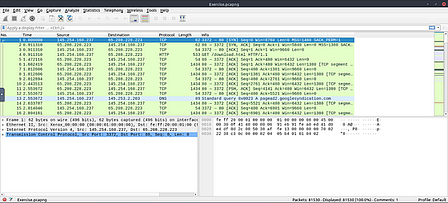
Now head back to the broswer tab that the VM instance is in. Wireshark should be open and ready to use.
Task 3 Statistics | Protocol Details
IPv4 and IPv6
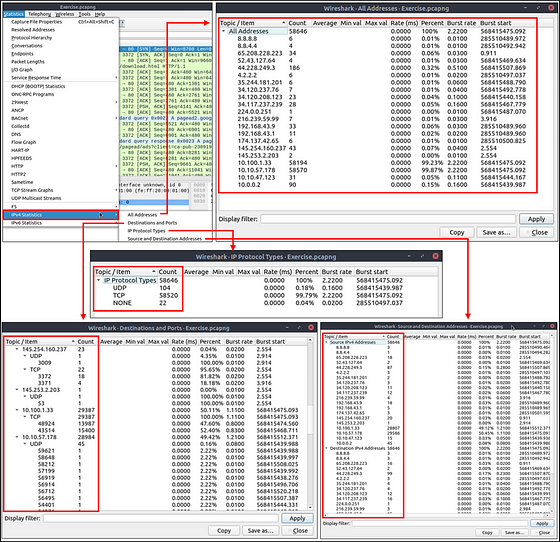
Up to here, almost all options provided information that contained both versions of the IP addresses. The statistics menu has two options for narrowing the statistics on packets containing a specific IP version. Thus, analysts can identify and list all events linked to specific IP versions in a single window and use it for the event of interest. You can use the “Statistics → IPvX Statistics” menu to view this info.
DNS
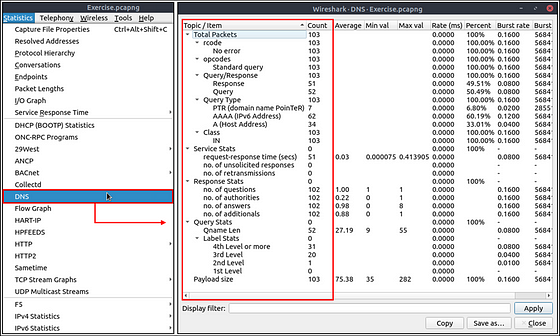
This option breaks down all DNS packets from the capture file and helps analysts view the findings in a tree view based on packet counters and percentages of the DNS protocol. Thus analysts can view the DNS service’s overall usage, including rcode, opcode, class, query type, service and query stats and use it for the event of interest. You can use the “Statistics → DNS” menu to view this info.
HTTP
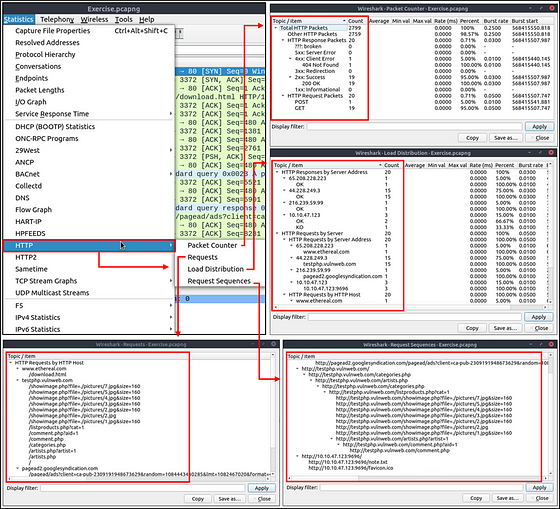
This option breaks down all HTTP packets from the capture file and helps analysts view the findings in a tree view based on packet counters and percentages of the HTTP protocol. Thus analysts can view the HTTP service’s overall usage, including request and response codes and the original requests. You can use the “Statistics → HTTP” menu to view this info.
Answer the questions below
What is the most used IPv4 destination address?
At the top of the Wireshark window, click on Statistics from the menu bar. In the drop-down, move your cursor down to IPv4 Statistics. Once you hover your cursor over IPv4 Statistics, another drop-down will appear. Move your cursor over to this new drop-down and click on Destinations and Ports.
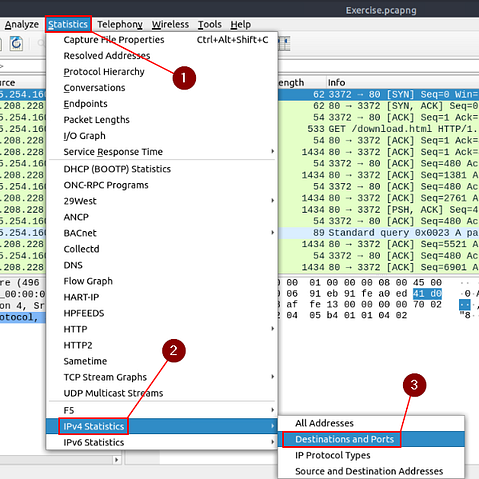
The Destinations and Ports window will pop-up. Give Wireshark a moment to finish calculating. Once it has finished, look at the column names at the top. You are looking for the column labeled Count. When you find it click on it twice to orginize the table from highest count to lowest count.
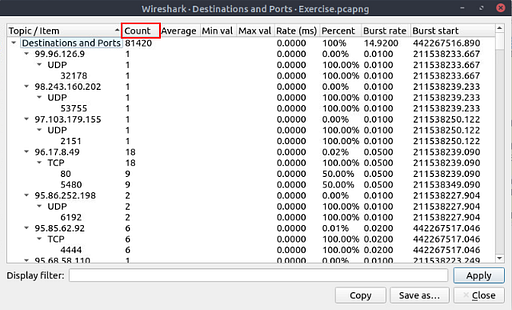
The IPv4 address at the top of the list is theDestination IPv4 address that appears the most in the pcapng file. This also is the answer to the question. Type the answer in the THM answer field, and then click submit.
Answer: 10.100.1.33
What is the max service request-response time of the DNS packets?
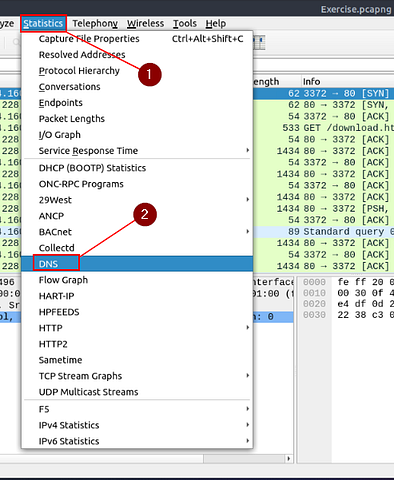
Heading back up to the top of the window, and click the Statistics tab. On the drop-down click the DNS option.
When the DNS window pops-up, look down the first column till you see request-response time (secs). Move to the right on the row, till you reach the column Max Val. The number in this column is the answer to the question. Type the answer in the THM answer field, and then click submit.
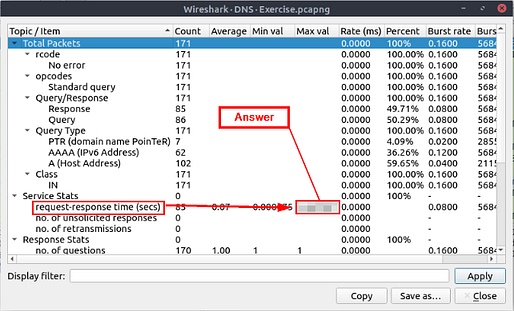
Answer: 0.467897
What is the number of HTTP Requests accomplished by “rad[.]msn[.]com?
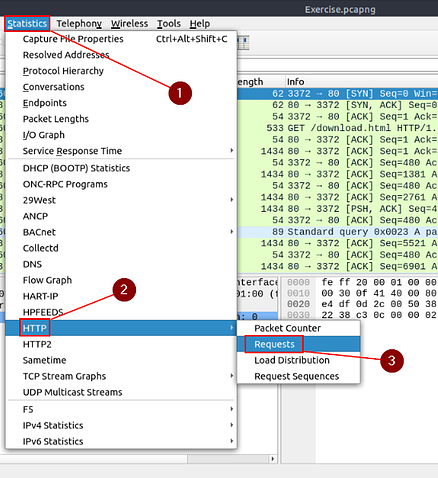
Heading back up to the top of the window, and click the Statistics tab. On the drop-down hover over the HTTP option. On the new drop-down menu, click the Requests option.
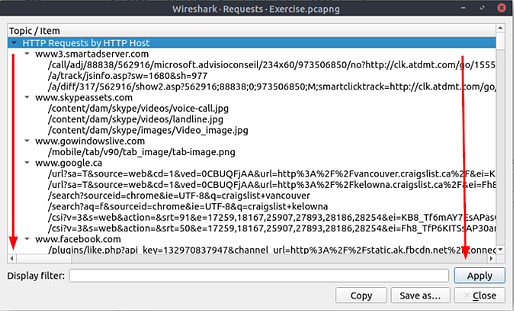
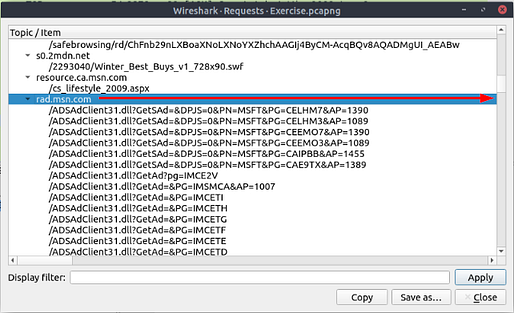
When the Requests pop-up window loads, scroll down till you see rad.msn.com.
Once you find it, scroll to the right of the row till you reach the next column.
When you reach the next column, it is labeled Count. The number you find in this column is the answer to the question. Type the answer in the THM answer field, and then click submit.
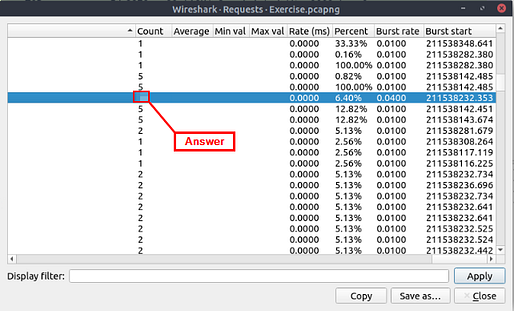
Answer: 39
Task 4 Packet Filtering | Principles
Packet Filtering
| In the previous room ([**Wireshark | The Basics**](https://tryhackme.com/room/wiresharkthebasics)), we covered packet filtering and how to filter packets without using queries. In this room, we will use queries to filter packets. As mentioned earlier, there are two types of filters in Wireshark. While both use similar syntax, they are used for different purposes. Let’s remember the difference between these two categories. |
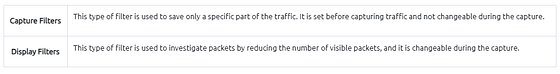
Note: You cannot use the display filter expressions for capturing traffic and vice versa.
The typical use case is capturing everything and filtering the packets according to the event of interest. Only experienced professionals use capture filters and sniff traffic. This is why Wireshark supports more protocol types in display filters. Please ensure you thoroughly learn how to use capture filters before using them in a live environment. Remember, you cannot capture the event of interest if your capture filter is not matching the specific traffic pattern you are looking for.
Capture Filter Syntax
These filters use byte offsets hex values and masks with boolean operators, and it is not easy to understand/predict the filter’s purpose at first glance. The base syntax is explained below:
- Scope: host, net, port and portrange.
- Direction: src, dst, src or dst, src and dst,
- Protocol: ether, wlan, ip, ip6, arp, rarp, tcp and udp.
- Sample filter to capture port 80 traffic:
tcp port 80
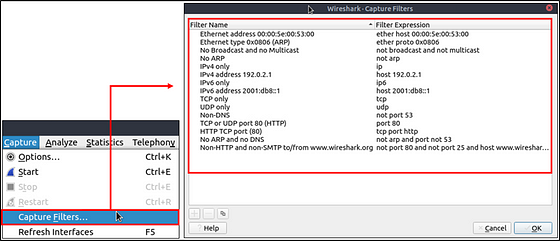
You can read more on capture filter syntax from here and here. A quick reference is available under the “Capture → Capture Filters” menu.
Display Filter Syntax
This is Wireshark’s most powerful feature. It supports 3000 protocols and allows conducting packet-level searches under the protocol breakdown. The official “Display Filter Reference” provides all supported protocols breakdown for filtering.
- Sample filter to capture port 80 traffic:
tcp.port == 80
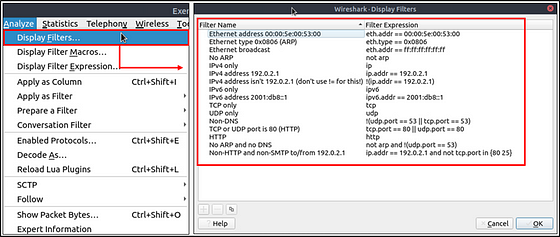
Wireshark has a built-in option (Display Filter Expression) that stores all supported protocol structures to help analysts create display filters. We will cover the “Display Filter Expression” menu later. Now let’s understand the fundamentals of the display filter operations. A quick reference is available under the “Analyse → Display Filters” menu.
Comparison Operators
You can create display filters by using different comparison operators to find the event of interest. The primary operators are shown in the table below.
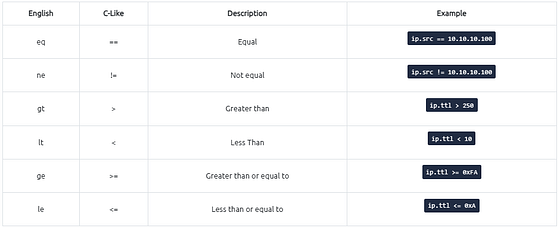
Note: Wireshark supports decimal and hexadecimal values in filtering. You can use any format you want according to the search you will conduct.
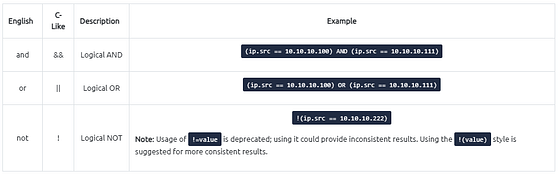
Logical Expressions
Wireshark supports boolean syntax. You can create display filters by using logical operators as well.
Packet Filter Toolbar
The filter toolbar is where you create and apply your display filters. It is a smart toolbar that helps you create valid display filters with ease. Before starting to filter packets, here are a few tips:
- Packet filters are defined in lowercase.
- Packet filters have an autocomplete feature to break down protocol details, and each detail is represented by a “dot”.
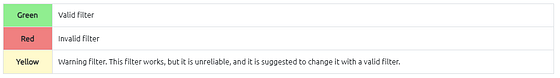
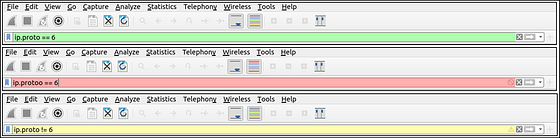
- Packet filters have a three-colour representation explained below.
Filter toolbar features are shown below.
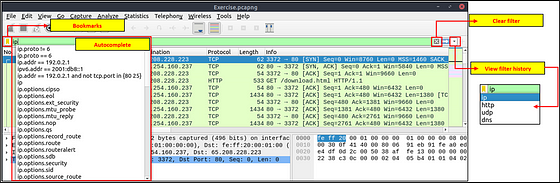
We’ve covered lots of principles and syntax. Let’s put these into practice and start filtering packets in the next task.
Task 5 Packet Filtering | Protocol Filters
Protocol Filters
As mentioned in the previous task, Wireshark supports 3000 protocols and allows packet-level investigation by filtering the protocol fields. This task shows the creation and usage of filters against different protocol fields.
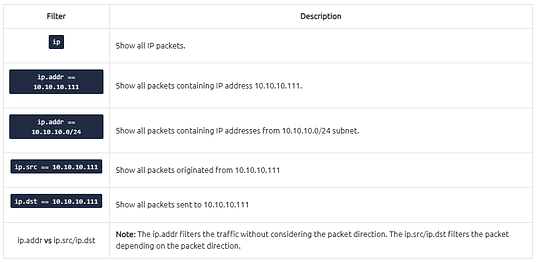
IP Filters
IP filters help analysts filter the traffic according to the IP level information from the packets (Network layer of the OSI model). This is one of the most commonly used filters in Wireshark. These filters filter network-level information like IP addresses, version, time to live, type of service, flags, and checksum values.
The common filters are shown in the given table.
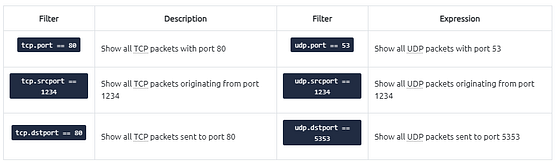
TCP and UDP Filters
TCP filters help analysts filter the traffic according to protocol-level information from the packets (Transport layer of the OSI model). These filters filter transport protocol level information like source and destination ports, sequence number, acknowledgement number, windows size, timestamps, flags, length and protocol errors.
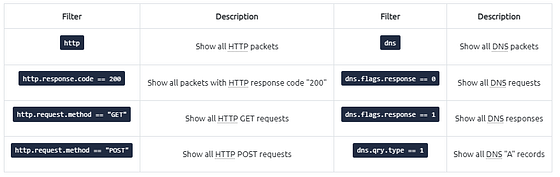
Application Level Protocol Filters | HTTP and DNS
Application-level protocol filters help analysts filter the traffic according to application protocol level information from the packets (Application layer of the OSI model ). These filters filter application-specific information, like payload and linked data, depending on the protocol type.
Display Filter Expressions
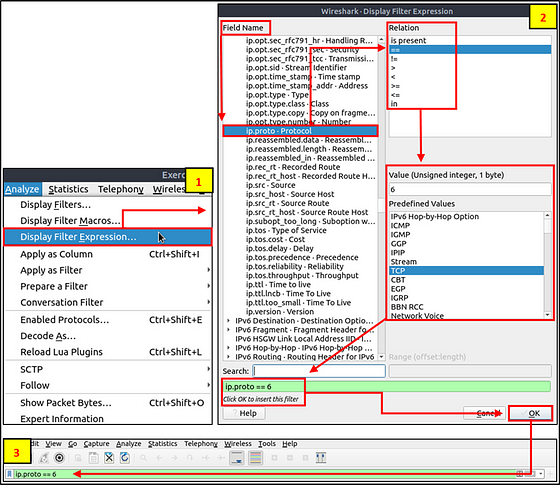
As mentioned earlier, Wireshark has a built-in option (Display Filter Expression) that stores all supported protocol structures to help analysts create display filters. When an analyst can’t recall the required filter for a specific protocol or is unsure about the assignable values for a filter, the Display Filter Expressions menu provides an easy-to-use display filter builder guide. It is available under the “Analyse → Display Filter Expression” menu.
It is impossible to memorise all details of the display filters for each protocol. Each protocol can have different fields and can accept various types of values. The Display Filter Expressions menu shows all protocol fields, accepted value types (integer or string) and predefined values (if any). Note that it will take time and require practice to master creating filters and learning the protocol filter fields.
Note: The first room introduced the “Colouring Rules” (Task-2). Now you know how to create display filters and filter the event of interest. You can use the “View → Coloring Rules” menu to assign colours to highlight your display filter results.
Answer the questions below
What is the number of IP packets?
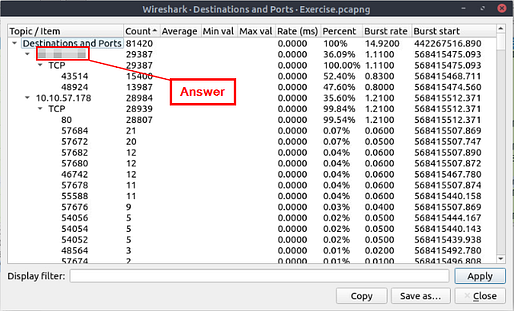
Starting at the Filter Bar, type in ip and press enter. It will filter pretty quickly. Look at the bottom right of the Wireshark window. You are looking for the word Displayed:. The numbers to the right of Displayed, is the answer. Type the answer in the THM answer field, and then click submit.
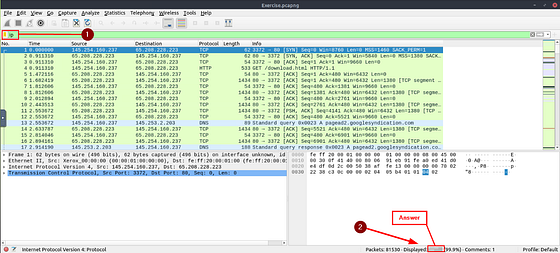
Answer: 81420
What is the number of packets with a “TTL value less than 10”?
Going back to the Filter Bar, this time we are looking for TTL. Keeping with the same filter we just in the previous question, we are going to add onto it. The filter will be ip.ttl <10, and will look for IPv4 address that have a time to live of less than 10. After you have entered in this filter, press enter to use it. You should only have the Packets that match the filter remaining. Again, go back down to Displayed in the bottom right of the Wireshark window. The number to the right is the answer to this question. Type the answer in the THM answer field, and then click submit.
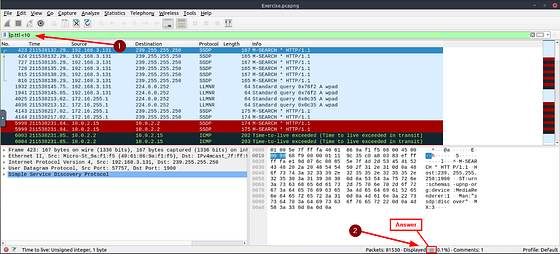
Answer: 66
What is the number of packets which uses “TCP port 4444”?
Going back to the Filter Bar, this time we are looking for Packets that use TCP over port 4444. So the filter you want to use is pretty straight forward. It is tcp.port == 4444, type this into the Filter Bar and press enter. Again, go back down to Displayed in the bottom right of the Wireshark window. The number to the right is the answer to this question. Type the answer in the THM answer field, and then click submit.
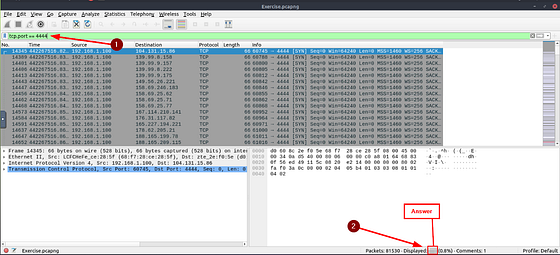
Answer: 632
What is the number of “HTTP GET” requests sent to port “80”?
Going back to the Filter Bar, this time we are looking for Packets that are making HTTP GET Requests over port 80. This one has a little more to it but it isn’t difficult if you build it using what is givin and know of HTTP requests. Let’s start with the HTTP request part, THM gave it to us in the question with http.request . From there we know from the question that we are looking for GET, which is the method of the HTTP request. So we can add method to our filter, so it is now http.request.method == GET. Now we have to add port 80, taking a queue from the previous question, we would need tcp.port == 80. Finally to combine these and search for both adding an and. So the final filter is now http.reqeust.method == GET and tcp.port == 80. Now that you have put the filter into the Filter Bar, press enter to use the filter. Again, go back down to Displayed in the bottom right of the Wireshark window. The number to the right is the answer to this question. Type the answer in the THM answer field, and then click submit.
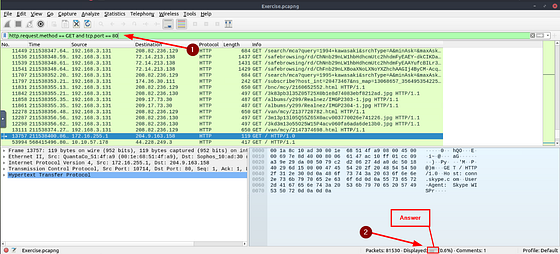
Answer: 527
What is the number of “type A DNS Queries”?
Last time going back to the Filter Bar, this time we are looking for Packets that are making DNS Queries, but only for type A. It sounds like this one is going to be complicated, but it’s quiet simple. Start typing in the Filter Bar, dns.. The first entry in the drop down menu looks like exactly what we are looking for.
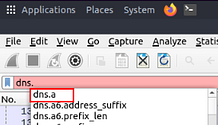
Either finish typing or click on the entry in the drop down menu. So that the filter should be dns.a. Press enter to use the filter. For the last time in this room, go back down to Displayed in the bottom right of the Wireshark window. The number to the right is the answer to this question. Type the answer in the THM answer field, and then click submit.
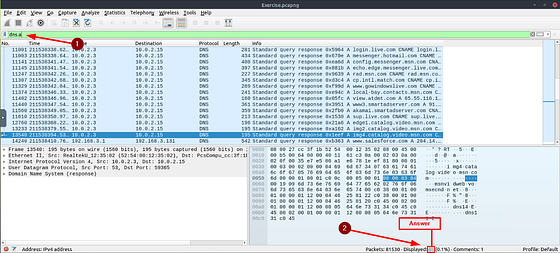
Answer: 51
You have finished these tasks and can now move on to Task 6 Advanced Filtering & Task 7 Conclusion.