If you haven’t done tasks 5 and 6 yet, here is the link to my write-up of them: Task 5 Tunneling Traffic: DNS and ICMP & Task 6 Cleartext Protocol Analysis: FTP
Getting the VM Started
Starting at Task 1, you will see the green Start Machine button. Click this button to get the VM Started.
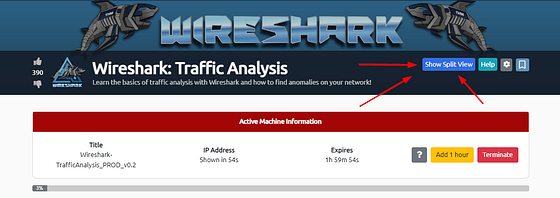
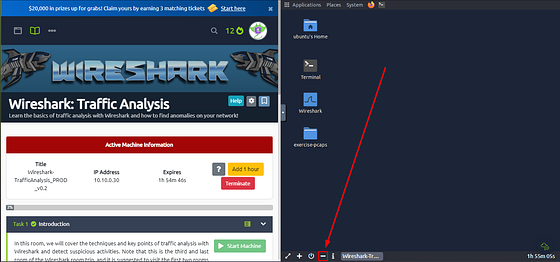
Scroll to the top where the banner is. On the right side of the page, you will see the blue Show Split view. Click this blue button.
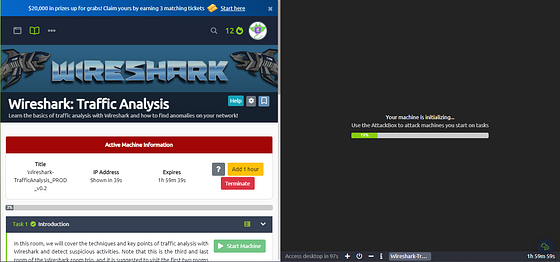
The page will split, now just wait till the VM loads.
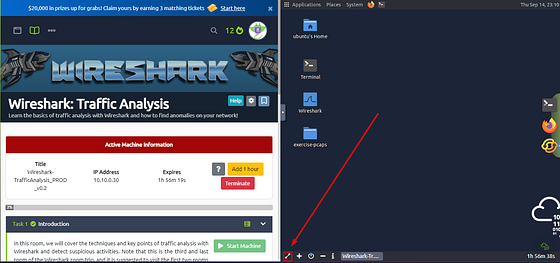
Once the VM loads, click the View in Full Screen icon in the bottom left of the VM.
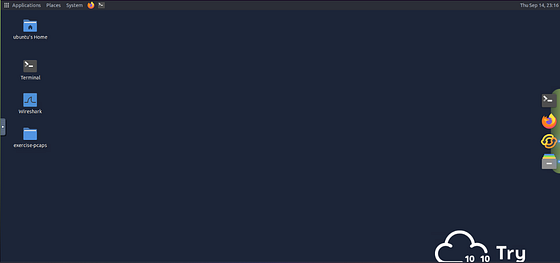
A new browser tab should open with the VM in it.
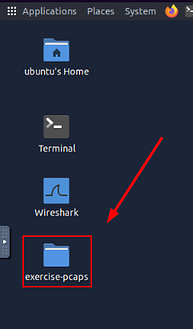
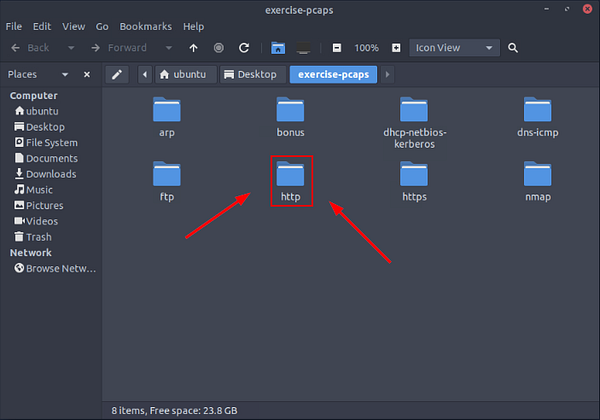
Double-Click on the e_xercise-pcap_ folder to open it.
While folder opens, head back to the THM Task Tab. At the bottom of the VM you will see a minus ( — ), this represents Exit Split View. Click the — to allow the THM task to incapsilate the entire window. This won’t close out of your VM instance, it will just be on the other tab.
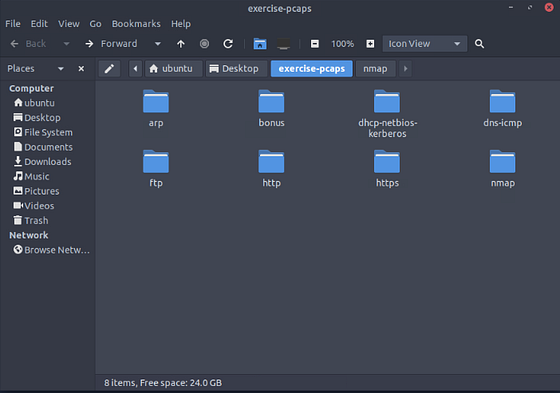
Heading back to the browser tab that the VM is in. The folder should be open. Inside this folder will be other folders containing the files needed for the tasks ahead. The folders are named accordingly to the task they are associated with.
Task 7 Cleartext Protocol Analysis: HTTP
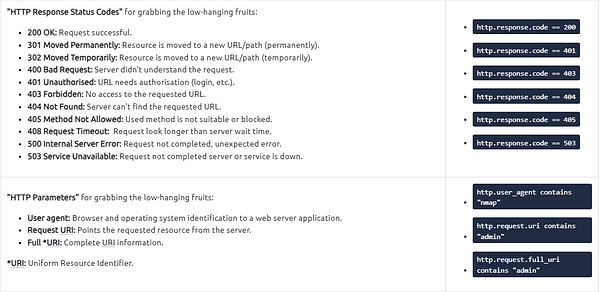
HTTP Analysis
Hypertext Transfer Protocol (HTTP) is a cleartext-based, request-response and client-server protocol. It is the standard type of network activity to request/serve web pages, and by default, it is not blocked by any network perimeter. As a result of being unencrypted and the backbone of web traffic, HTTP is one of the must-to-know protocols in traffic analysis. Following attacks could be detected with the help of HTTP analysis:
- Phishing pages
- Web attacks
- Data exfiltration
- Command and control traffic (C2)
HTTP analysis in a nutshell:
User Agent Analysis
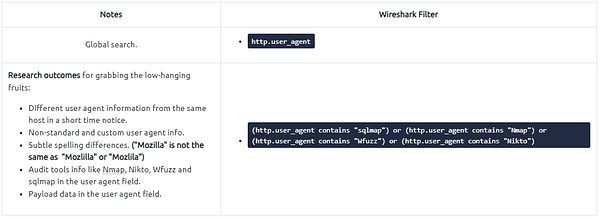
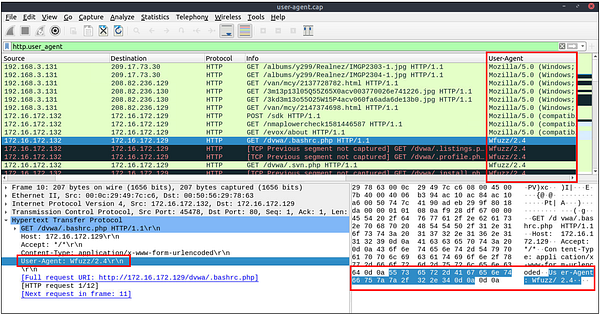
As the adversaries use sophisticated technics to accomplish attacks, they try to leave traces similar to natural traffic through the known and trusted protocols. For a security analyst, it is important to spot the anomaly signs on the bits and pieces of the packets. The “user-agent” field is one of the great resources for spotting anomalies in HTTP traffic. In some cases, adversaries successfully modify the user-agent data, which could look super natural. A security analyst cannot rely only on the user-agent field to spot an anomaly. Never whitelist a user agent, even if it looks natural. User agent-based anomaly/threat detection/hunting is an additional data source to check and is useful when there is an obvious anomaly. If you are unsure about a value, you can conduct a web search to validate your findings with the default and normal user-agent info (example site).
User Agent analysis in a nutshell:
Log4j Analysis
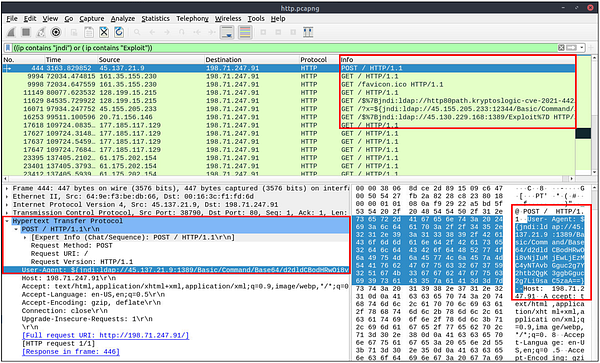
A proper investigation starts with prior research on threats and anomalies going to be hunted. Let’s review the knowns on the “Log4j” attack before launching Wireshark.
Log4j vulnerability analysis in a nutshell:
Detecting suspicious activities in chunked files is easy and a great way to learn how to focus on the details. Now use the exercise files to put your skills into practice against a single capture file and answer the questions below!
Answer the questions below
Use the “Desktop/exercise-pcaps/http/user-agent.cap” file.
Inside the exercise-pcaps folder, double-click on the http folder.
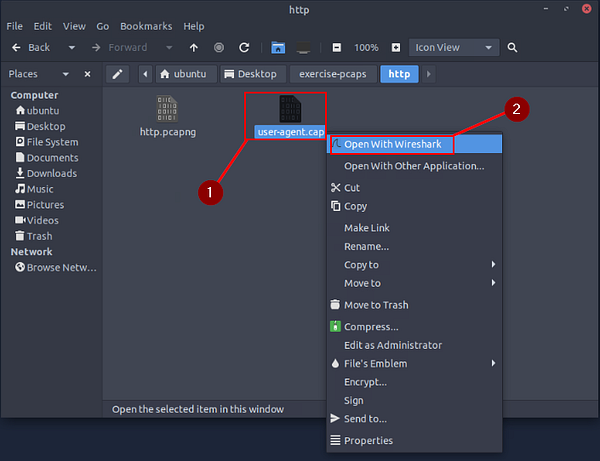
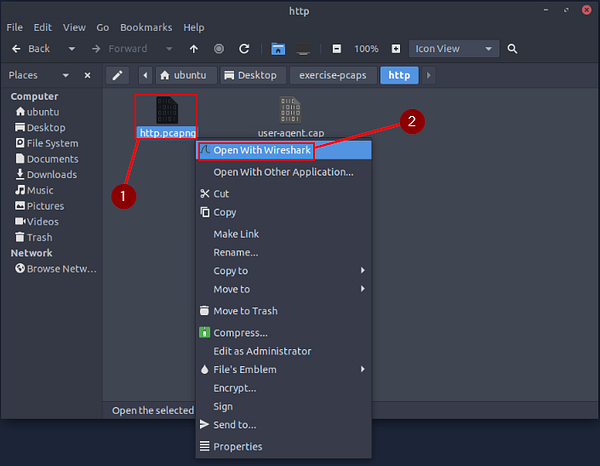
Inside the http folder you will see the user-agent.cap file. Right-click on it, then choose Open With Wireshark from the drop-down menu.
Investigate the user agents. What is the number of anomalous “user-agent” types?
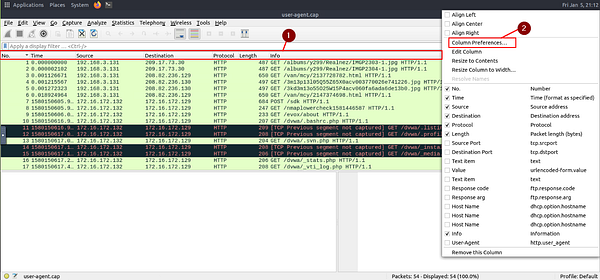
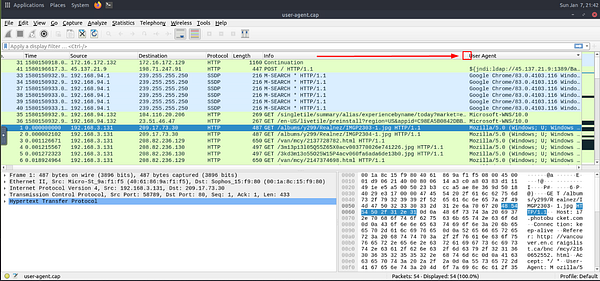
To make this task a bit easier, we need to do a little prep. Inside of Wireshark, right-click on the Column names that are underneath the filter bar. Once you have right-clicked on this row, a drop-down menu will appear. Click on Column Preferences….
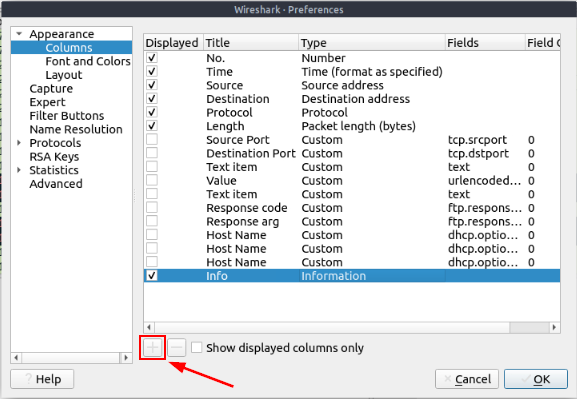
The Wireshark Preferences window will pop up onto your screen. From here, there is a + icon under the different column’s that can be displayed. Click the + icon.
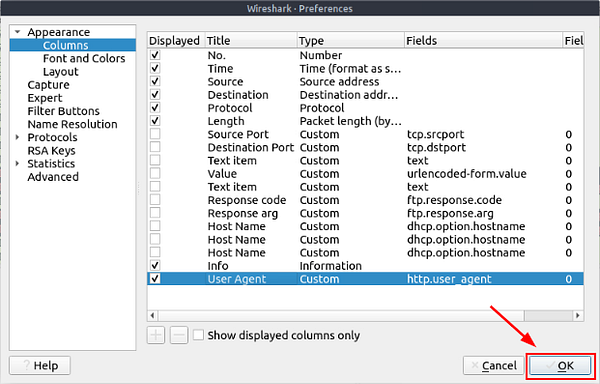
A new row will appear in the chart. You will need to interact with both the Title and Fields cells of the new row. To do this, you will only need to double-click on the cell. So for the Title cell, you can name it User Agent. Then for the Fields cell, you will put in the filter needed to show the User Agent. That filter is http.user_agent. Once you have done this, the Type cell will change from Number to Custom. This is normal and good.
Click on the OK button, in the bottom right of the window.
The Wireshark Preferences window will disappear. You should see the main Wireshark window. But, looking to the right, you will see the new Column we just added to the Packet List section. Click on the new User Agent column to organize the Packet List by User Agent.
Looking through the different User Agents, I was still coming to a wall. So I took a look at the Hint, it shares about looking into the Windows NT 6.4. So I did a little Googling, and found this Article , that explains that there is no such Windows User Agent Version. It goes from Windows NT 6.3 to Windows NT 10. So we have found our Anomolous Packets. Time to count them. Once you have counted the number of Packets that contain this User Agent. Type this number into the TryHackMe answer field, then click submit.
Answer: 6
What is the packet number with a subtle spelling difference in the user agent field?
Hover your cursor over the divide bar to the right of the_User Agent_ column we created. Once the cursor changes to arrows pointing both ways, Click and Hold then slide the column to the left to expand it. If needed, repeat this same step on the right side to expand the column some more.
Now that the column is expanded, it’s time to start parsing through the information.
Once you find the spelling error, look at the first column on the left. This is the Packet Number. Take this number and type it into the TryHackMe answer field. Then click Submit.
Answer: 52
Use the “Desktop/exercise-pcaps/http/http.pcapng” file.
Going back to the http folder, right-click on the http.pcapng file. From the drop-down menu, click on Open With Wireshark.
Locate the “Log4j” attack starting phase. What is the packet number?
Looking over the section above in regards to Log4j, it gives us some areas to start with. Since we are looking for the starting phase packet number, the table tells us that the attack starts with a POST request. Along with some known cleartext patterns. Let’s build a filter, head back to Wireshark.
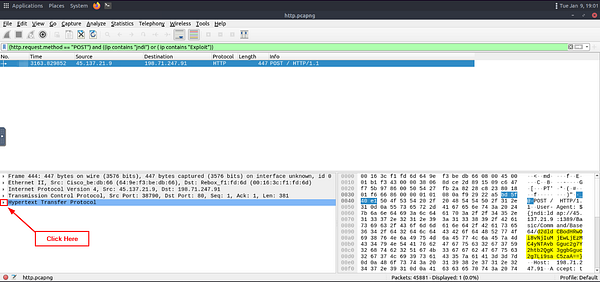
In the mint green filter bar let’s create our filter. We will start by encapsilating the first pramater in (). Our first parameter is filtering only POST request, to do this use (http.request.method == “POST”) . We then want to add and to let Wireshark know that the filter needs to match both parameters to get a result. Next we again are using () to encapsilate the parameters and function. The parameter this time is looking for the clear text patterns in the IP field. Here is how this should look ((ip contains “jndi”) or ( ip contains “Exploit”)). We use the double (), with the or function to say that this parameter can match either one of these filters. If it does along with it being a POST Request, then a result will be given. The full filter will look like this: (http.request.method == “POST”) and ((ip contains “jndi”) or ( ip contains “Exploit”)). Once you have this typed into the filter bar, press enter to run.
You will be left with one result. Look at the Packet number in the first column of the Packet List Section. Type this number into the TryHackMe answer field, then click Submit.
Answer: 444
Locate the “Log4j” attack starting phase and decode the base64 command. What is the IP address contacted by the adversary? (Enter the address in defanged format and exclude “{}”.)
Going back to Wireshark, we can see in the hex output of the packet the Base64 string. We need to copy this string so we can decode it. The easiest way is to click the drop-down carot for HyperText Transfer Protocol found in the Packet Detail Section.
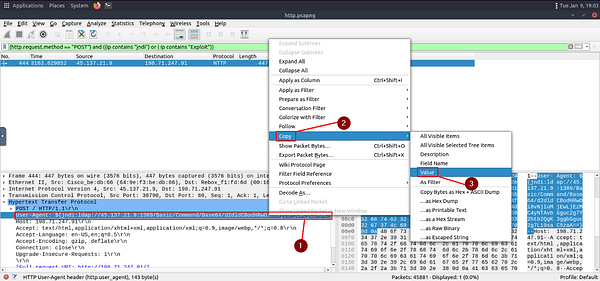
Once we have done that, we can see the User-Agent Field. The Base64 value can be found in the field. Start by right-clicking the User-Agent field. In the drop-down menu, hover your cursor over Copy. A new drop down will appear. Move your cursor over to Value, then click on it. The User-Agent is now copied!
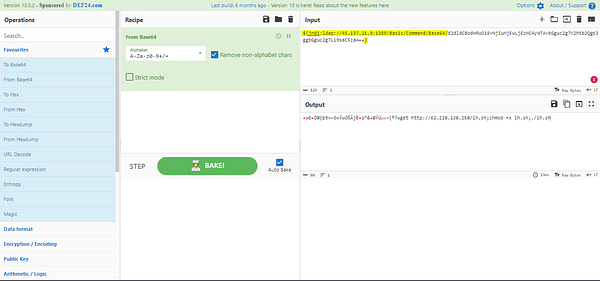
Now head over to CyberChef, time to work some magic. In the Input field, paste the User-Agent String. Under Operations drag and drop From Base64 into the Recipe field.
As we can see we have some extra info that we don’t need. Remove all the characters starting at the $ and ending at Base64/. Then finally the }, at the end of the User-Agent String. You should be left with the Base64 String.
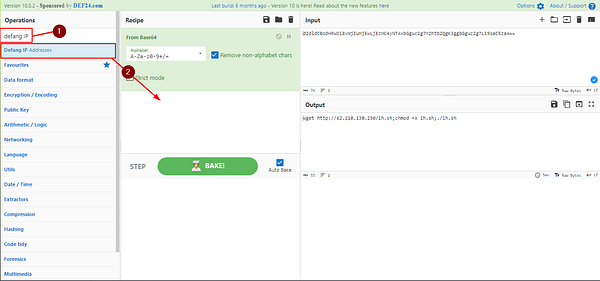
You should now be able to see the IP address in the Output field, with the rest of the command from the Base64 String. But we need it to be defanged for the answer. To do this we need to search defang IP in the search field under Operations. After typing defang IP, you should see it at the top of the list/under the search field. Drag and drop it over into the Recipe field.
You will now see the defanged IP in the Output field. Higlight the defanged IP, then copy (ctrl+c) and paste(ctrl+v) into the TryHackMe answer field. Then click Submit.
Answer: 62[.]210[.]130[.]250
Task 8 Encrypted Protocol Analysis: Decrypting HTTPS
Decrypting HTTPS Traffic
When investigating web traffic, analysts often run across encrypted traffic. This is caused by using the Hypertext Transfer Protocol Secure (HTTPS) protocol for enhanced security against spoofing, sniffing and intercepting attacks. HTTPS uses TLS protocol to encrypt communications, so it is impossible to decrypt the traffic and view the transferred data without having the encryption/decryption key pairs. As this protocol provides a good level of security for transmitting sensitive data, attackers and malicious websites also use HTTPS. Therefore, a security analyst should know how to use key files to decrypt encrypted traffic and investigate the traffic activity.
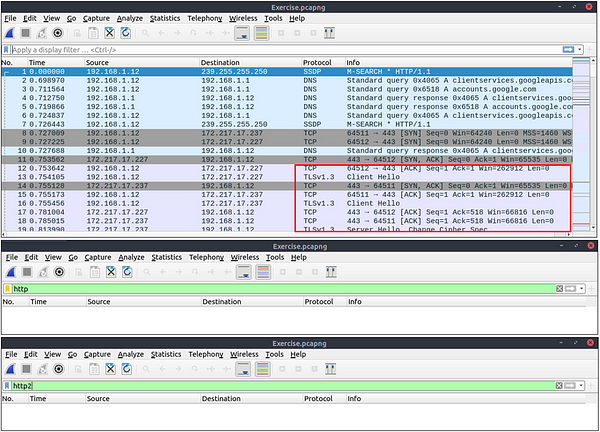
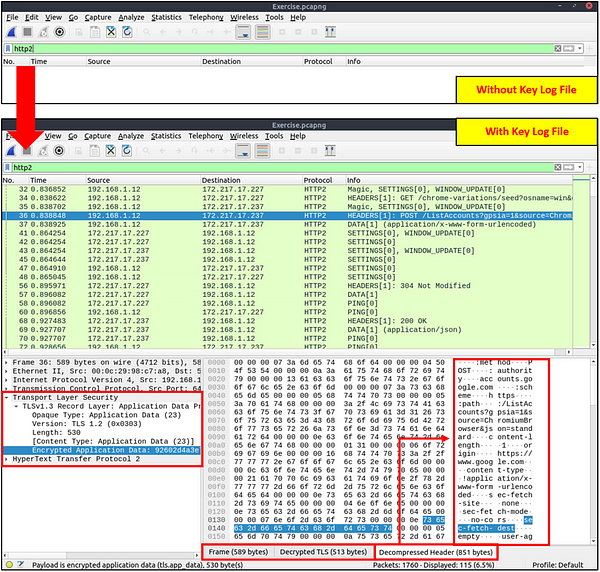
The packets will appear in different colours as the HTTP traffic is encrypted. Also, protocol and info details (actual URL address and data returned from the server) will not be fully visible. The first image below shows the HTTP packets encrypted with the TLS protocol. The second and third images demonstrate filtering HTTP packets without using a key log file.
Additional information for HTTPS :
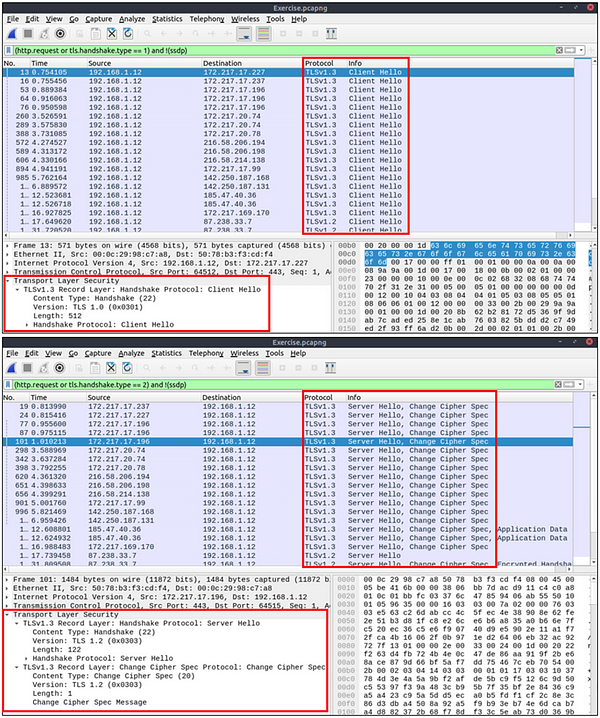
Similar to the TCP three-way handshake process, the TLS protocol has its handshake process. The first two steps contain “Client Hello” and “Server Hello” messages. The given filters show the initial hello packets in a capture file. These filters are helpful to spot which IP addresses are involved in the TLS handshake.
- Client Hello:
(http.request or tls.handshake.type == 1) and !(ssdp) - Server Hello:
(http.request or tls.handshake.type == 2) and !(ssdp)
An encryption key log file is a text file that contains unique key pairs to decrypt the encrypted traffic session. These key pairs are automatically created (per session) when a connection is established with an SSL/TLS-enabled webpage. As these processes are all accomplished in the browser, you need to configure your system and use a suitable browser (Chrome and Firefox support this) to save these values as a key log file. To do this, you will need to set up an environment variable and create the SSLKEYLOGFILE, and the browser will dump the keys to this file as you browse the web. SSL/TLS key pairs are created per session at the connection time, so it is important to dump the keys during the traffic capture. Otherwise, it is not possible to create/generate a suitable key log file to decrypt captured traffic. You can use the “right-click” menu or “Edit → Preferences → Protocols → TLS” menu to add/remove key log files.
Adding key log files with the “right-click” menu:
Adding key log files with the “Edit → Preferences → Protocols → TLS” menu:
Viewing the traffic with/without the key log files:
The above image shows that the traffic details are visible after using the key log file. Note that the packet details and bytes pane provides the data in different formats for investigation. Decompressed header info and HTTP2 packet details are available after decrypting the traffic. Depending on the packet details, you can also have the following data formats:
- Frame
- Decrypted TLS
- Decompressed Header
- Reassembled TCP
- Reassembled SSL
Detecting suspicious activities in chunked files is easy and a great way to learn how to focus on the details. Now use the exercise files to put your skills into practice against a single capture file and answer the questions below!
Answer the questions below
Use the “Desktop/exercise-pcaps/https/Exercise.pcap” file.
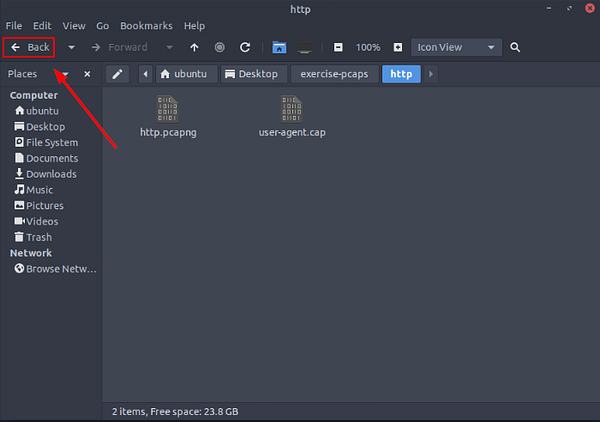
Going back to the folder where the pcapng file is located. Click on the Back button in the upper left of the dns-icmp folder’s window.
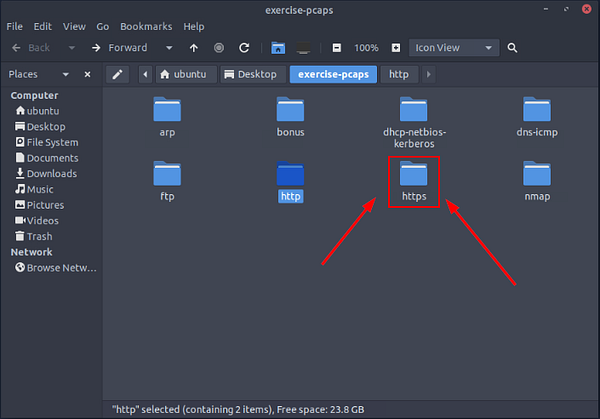
Now being in the exercise-pcaps folder, double-click on https folder to open it.
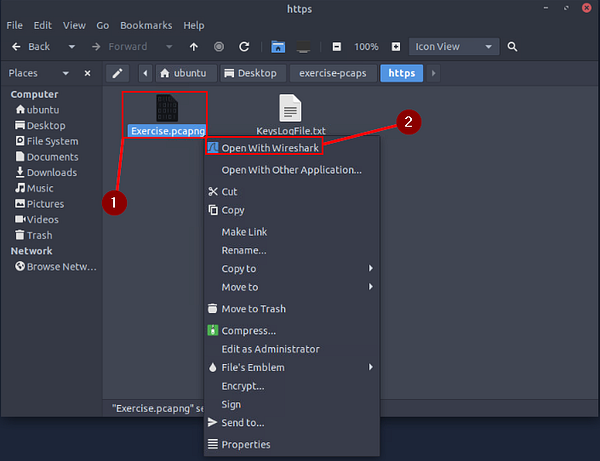
Now being inside the ftp folder, right-click on the Exercise.pcapng file. From the drop-down menu, click on Open With Wireshark.
What is the frame number of the “Client Hello” message sent to “accounts.google.com”?
Reading through the materials above. TryHackMe gave us a great start with a filter that will get us only the Client Hello.
Copy and Paste or type the filter for Client Hello into the mint green filter bar. Once entered in the filter bar press enter to run the filter.
Now we are only left with the Client Hello packets. We need to find the one that was sent to accounts.google.com. If we look at the hex dump of the packet. We can see the word google in it. Click on google in the hexdump to expand upon it in the Packet Detail section.
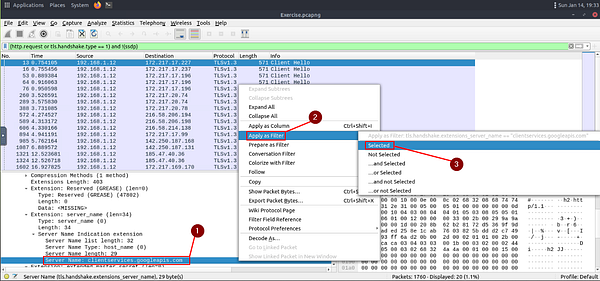
In the Packet Detail section you will see Server Name: clientservices.googleapis.com highlighted. This isn’t the server we are looking for, but it will help us to locate the accounts.google.com. We first need to right-click on Server Name: clientservices.googleapis.com. This will bring up a drop-down menu. Move your cursor over the Apply as Filter. A new drop-down will appear, move your cursor over to Selected and click on it.
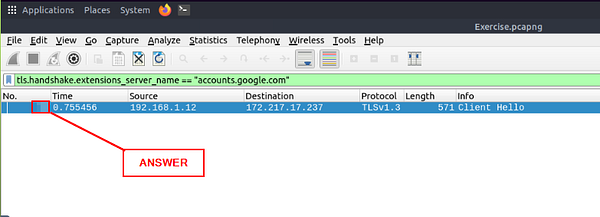
Looking at the mint green filter bar, we can see the new filter we ran. But as I said before, clientservices.googleapis.com is not the Name Server we are looking for. So let’s change that! Remove clientservices.googleapis.com and replace it with accounts.google.com. Once you have it replaced, press enter to run the new/updated filter.
You will be left with one packet left. Look at the Packet Number from the first column. Once you see it type the answer into the TryHackMe answer field, then click submit.
Answer: 16
Decrypt the traffic with the “KeysLogFile.txt” file. What is the number of HTTP2 packets?
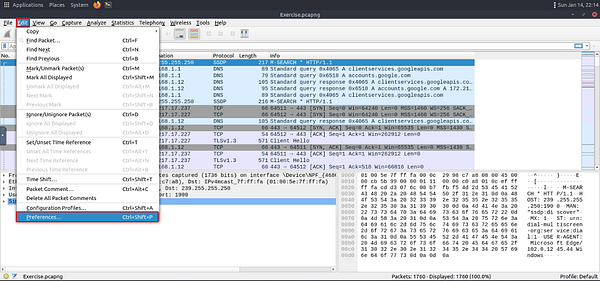
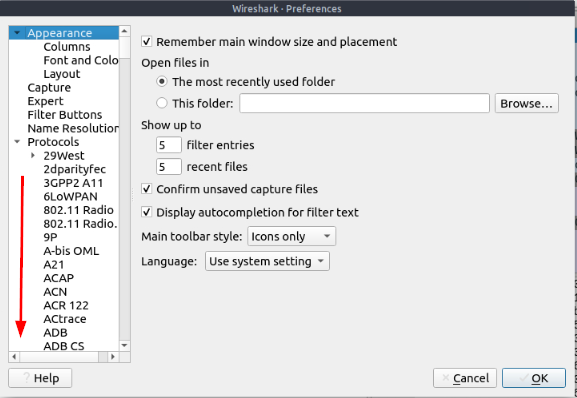
First let’s decrypt the traffic. To do so click Edit in the top left of Wireshark. From the drop-down menu, move your cursor to the bottom where it say Preferences and click on it.
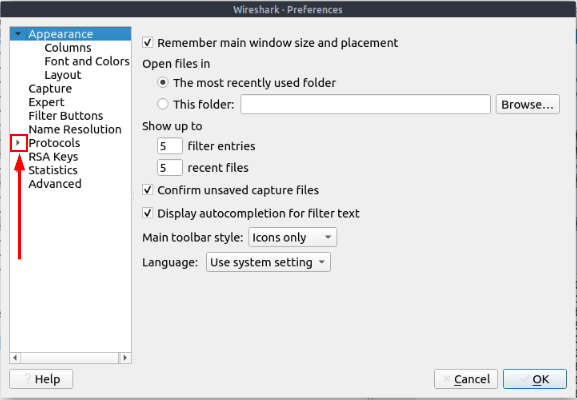
The Wireshark Preference window will pop-up in the middle of the screen. Find Protocols, click the down carot that is on the left.
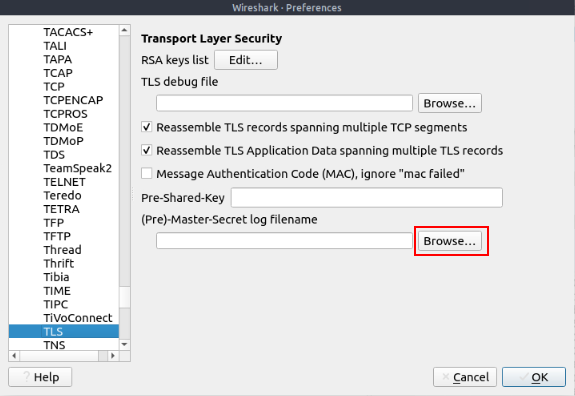
Now either scroll down till you see TLS or type TLS quickly to be taken to it.
Look for (Pre)-Master-Secret log filename, you will see a field under with a Browse… button to the right. Click on this Browse… button.
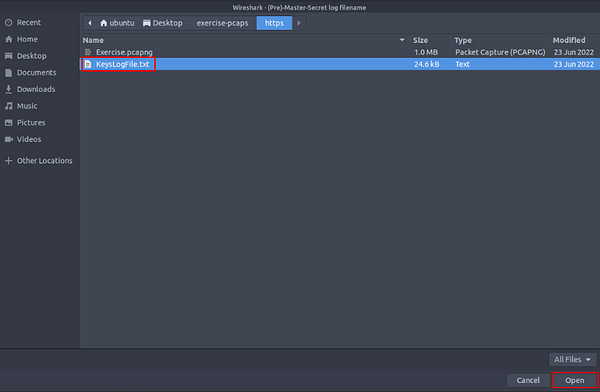
A File Explorer Window will pop-up. If you remember, when we opened the PCAP file, there was another file in the folder. This file is KeysLogFile.txt, and the file we are looking for. So we need to navigate to this file. To do so follow the path of Desktop > exercist-pcaps > https. Once in the folderwe see the KeysLogFile.txt.
To select the file, either double-click on KeysLogFile.txt. Or click on KeysLogFile.txt then click on the Open button in the bottom right of the File Explorer Window.
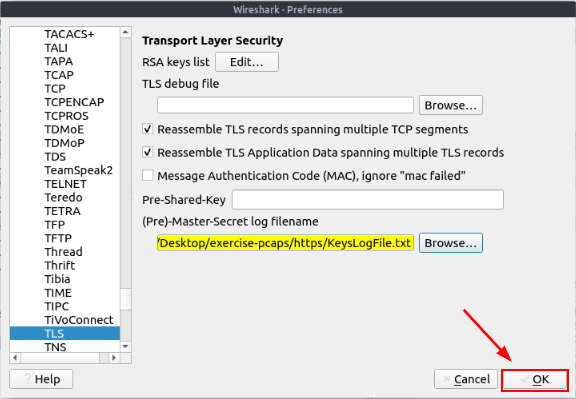
You will be brought back to the Wireshark Preferences window. We can now see that the file along with the absolute path is in the (Pre)-Master-Secret Log Filename field. Next you can click the Ok button in the bottom right of the Wireshark Prefernces window.
Since the question is looking for the number of packets that are http2 protocol. Then we need to filter for http2, which is quiet simple as the filter is http2. Type this into the mint green filter bar, then press enter to run.
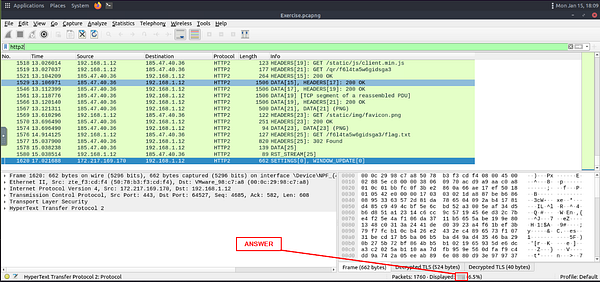
Looking to the bottom right of the Wireshark window you will see the word Displayed. The number to the right of this is the number and http2 packets and thus the answer to this question. Once you found it type the answer into the TryHackMe answer field, and click the Submit button.
Answer: 115
Go to Frame 322. What is the authority header of the HTTP2 packet? (Enter the address in defanged format.)
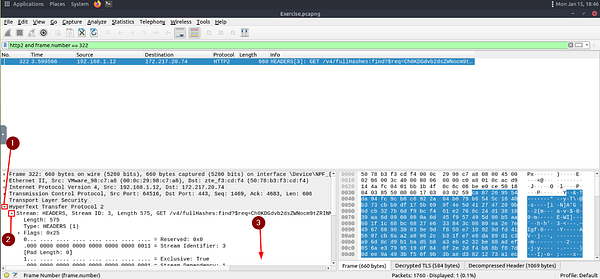
Keeping the filter from the previous question, let’s elaborate on it. Since we want to see Frame 322, we can add to our filter the following. Start with and as we want the filter to match both http2 along with our frame number. Then we will add frame.number == 322, which is looking for Frame 322. Once we have our filter build, press enter to run it.
Looking in the Packet Details section, look for HyperText Transfer Protocol. Once you find it click the carot to the left of it to drop-down more information. You will see a new line, and thats it. But we can drop-down some more. So click the carot to the left of Stream: to discover more information. Now we can scroll down till we see the Header: :authority: field.
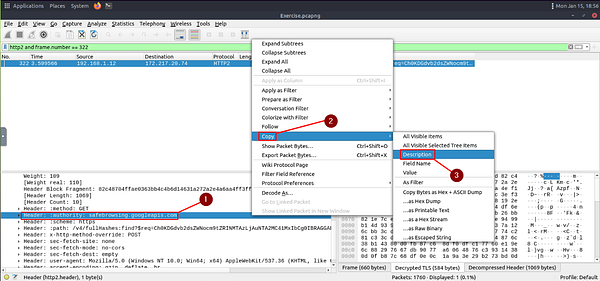
Once we see the Header: :authority: field, we can see the domain name. But the question is asking for the domain to be defanged. So we need to grab the domain. To do this right-click on Header: :authority: field. A drop-down menu will appear, hover your cursor over Copy. A new drop-down will appear. Move your cursor over to Description, then click on it. You now have what you need, time to head over to CyberChef.
Once at CyberChef, type defang in the input field under Operations. The top result will be Defang URL. Drag and drop Defang URL into the Recipe area.
Now paste in the Description/Domain we copied from WireShark. CyberChef should automatically defang the URL which you will see in the Output field. Now Copy and Paste the defanged URL into the TryHackMe answer field, then click the Submit button.
Answer: safebrowsing[.]googleapis[.]com
Investigate the decrypted packets and find the flag! What is the flag?
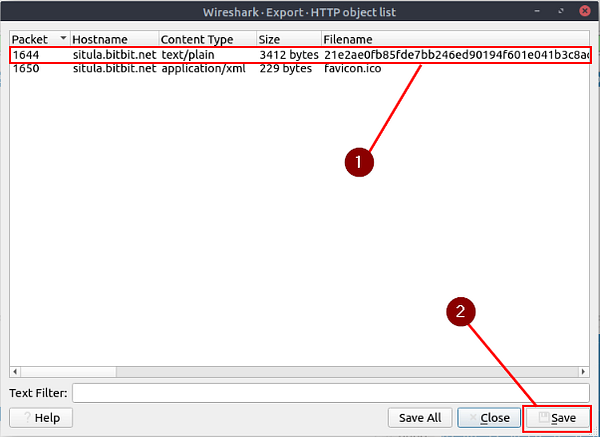
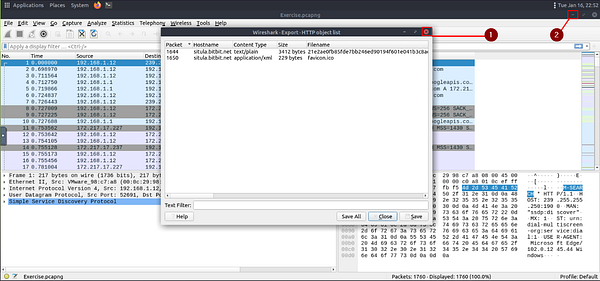
Time to use our investigation skills we have learned so far. Since we are looking at http traffic, the first place I like to look is Export Objects. Export Objects is where you can export/save files that were captured in the PCAP file. To do this first click on File in the top right of the Wireshark window. On the drop-down menu, move your cursor to hover over Export Objects. A new drop-down will appear. On this drop-down you will see HTTP…, click on HTTP…
We can see two files that were captured from the HTTP Protocol. The first one has an interesting Filename, let’s check it out. To do this click on the first row with the interesting Filename. Then click the Save button in the bottom right of the Wireshark Export HTTP object list.
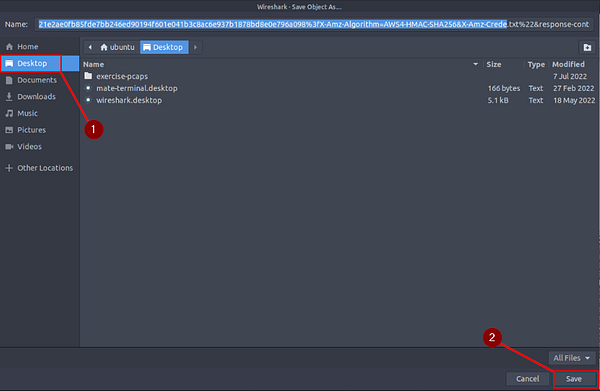
The Wireshark Save Object As… window will popup. On the left side of this window we can see Desktop, click on Desktop. Now click the Save button in the bottom right of the window.
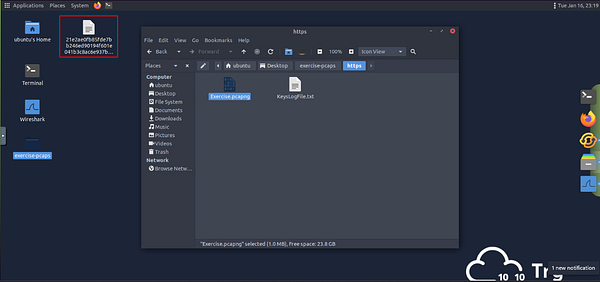
The file is now saved to the Desktop, so let’s head there. First X out of the Wireshark Export HTTP object list window. Then Minimize the Wireshark window.
We can now see the new file on the desktop. Let’s open it by double-clicking on the new file on the desktop.
Once the file opens, we are greeted with some sweet ASCII art and what looks like the flag!! Highlight and copy the flag, then paste the answer in the TryHackMe answer field, and click the Submit button.
Answer: FLAG{THM-PACKETMASTER}
