Learn the basics of traffic analysis with Wireshark and how to find anomalies on your network!
Task 1 Introduction
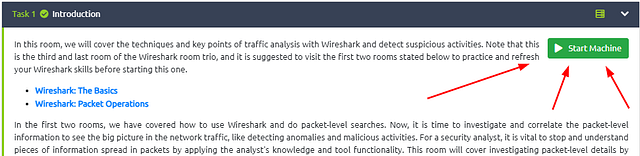
In this room, we will cover the techniques and key points of traffic analysis with Wireshark and detect suspicious activities. Note that this is the third and last room of the Wireshark room trio, and it is suggested to visit the first two rooms stated below to practice and refresh your Wireshark skills before starting this one.
In the first two rooms, we have covered how to use Wireshark and do packet-level searches. Now, it is time to investigate and correlate the packet-level information to see the big picture in the network traffic, like detecting anomalies and malicious activities. For a security analyst, it is vital to stop and understand pieces of information spread in packets by applying the analyst’s knowledge and tool functionality. This room will cover investigating packet-level details by synthesising the analyst knowledge and Wireshark functionality for detecting anomalies and odd situations for a given case.
Note: A VM is attached to this room. You don’t need SSH or RDP; the room provides a “Split View” feature. DO NOT directly interact with any domains and IP addresses in this room. The domains and IP addresses are included only for reference reasons.
Getting the VM Started
Starting at Task 1, you will see the green Start Machine button. Click this button to get the VM Started.
Scroll to the top where the banner is. On the right side of the page, you will see the blue Show Split view. Click this blue button.
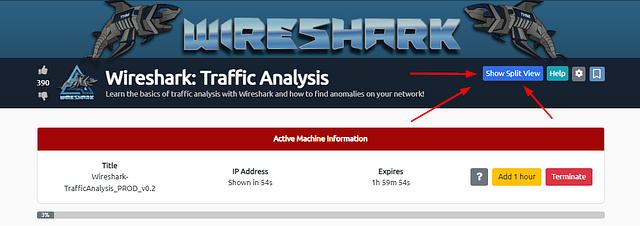
The page will split, now just wait till the VM loads.
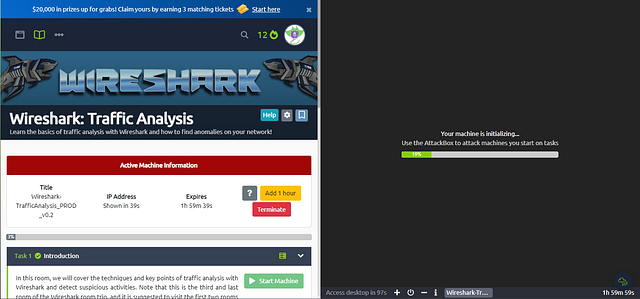
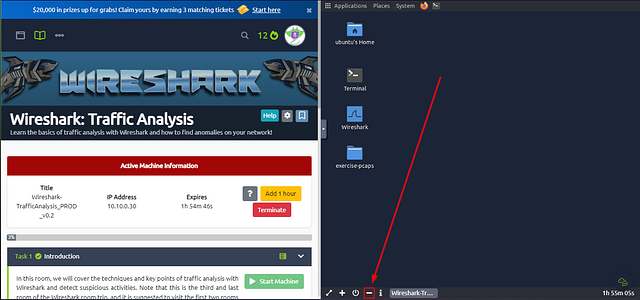
Once the VM loads, click the View in Full Screen icon in the bottom left of the VM.
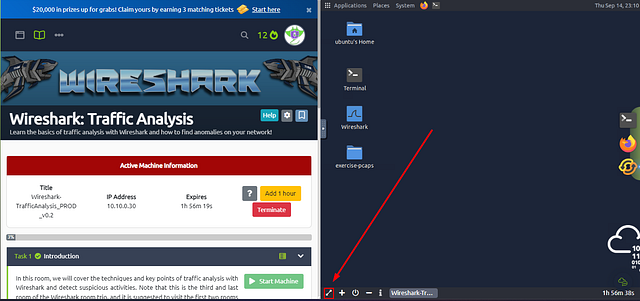
A new browser tab should open with the VM in it.
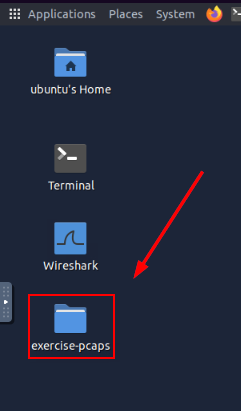
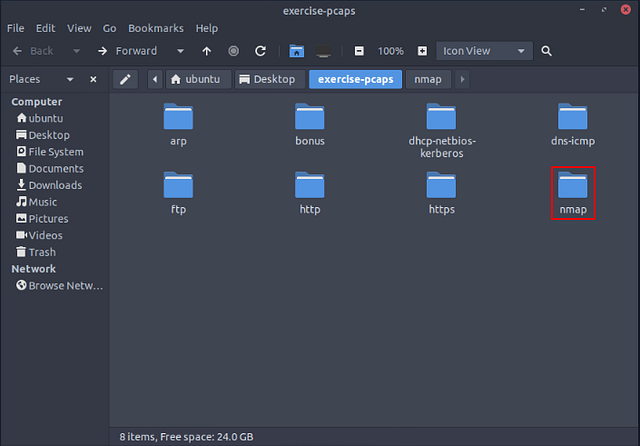
Double-Click on the e_xercise-pcap_ folder to open it.
While folder opens, head back to the THM Task Tab. At the bottom of the VM you will see a minus ( — ), this represents Exit Split View. Click the — to allow the THM task to incapsilate the entire window. This won’t close out of your VM instance, it will just be on the other tab.
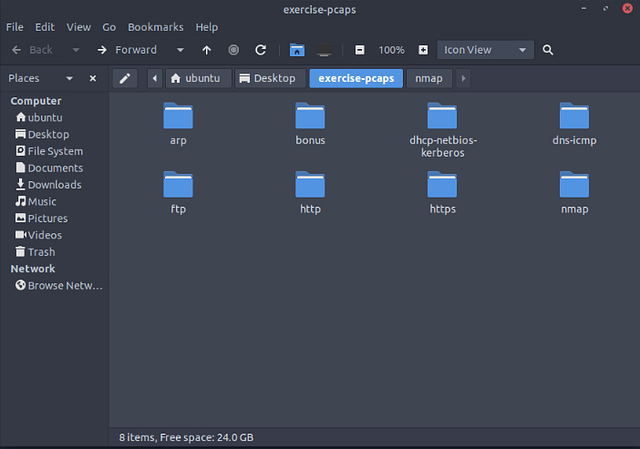
Heading back to the browser tab that the VM is in. The folder should be open. Inside this folder will be other folders containing the files needed for the tasks ahead. The folders are named accordingly to the task they are associated with.
Task 2 Nmap Scans
Nmap Scans
Nmap is an industry-standard tool for mapping networks, identifying live hosts and discovering the services. As it is one of the most used network scanner tools, a security analyst should identify the network patterns created with it. This section will cover identifying the most common Nmap scan types.
- TCP connect scans
- SYN scans
- UDP scans
It is essential to know how Nmap scans work to spot scan activity on the network. However, it is impossible to understand the scan details without using the correct filters. Below are the base filters to probe Nmap scan behaviour on the network.
TCP flags in a nutshell. 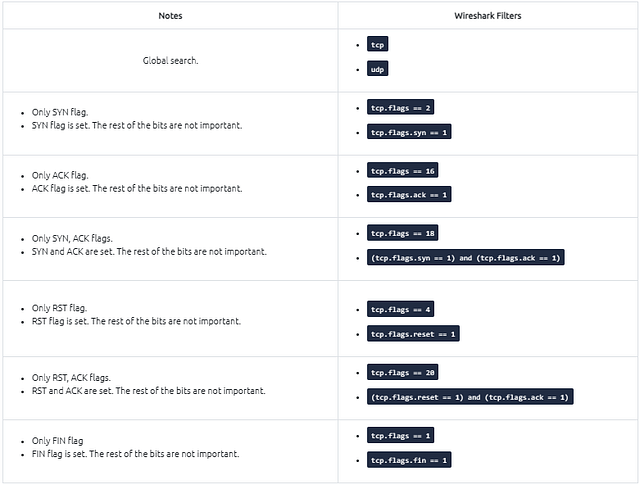
TCP Connect Scans
TCP Connect Scan in a nutshell:
- Relies on the three-way handshake (needs to finish the handshake process).
- Usually conducted with
nmap -sTcommand. - Used by non-privileged users (only option for a non-root user).
- Usually has a windows size larger than 1024 bytes as the request expects some data due to the nature of the protocol.
![]()
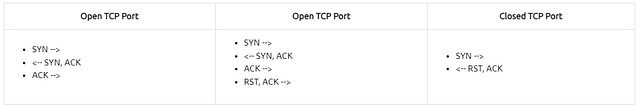
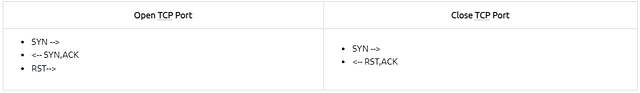
The images below show the three-way handshake process of the open and close TCP ports. Images and pcap samples are split to make the investigation easier and understand each case’s details.
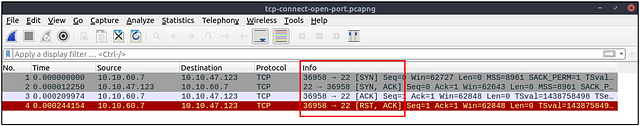
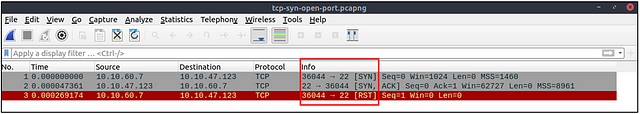
Open TCP port (Connect):
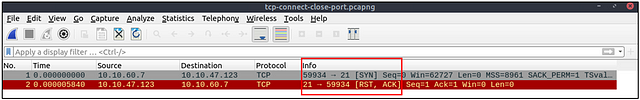
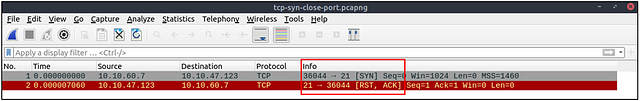
Closed TCP port (Connect):
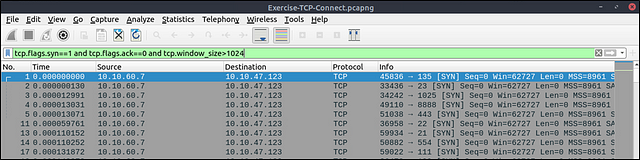
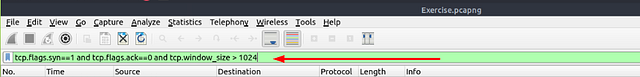
The above images provide the patterns in isolated traffic. However, it is not always easy to spot the given patterns in big capture files. Therefore analysts need to use a generic filter to view the initial anomaly patterns, and then it will be easier to focus on a specific traffic point. The given filter shows the TCP Connect scan patterns in a capture file.
tcp.flags.syn==1 and tcp.flags.ack==0 and tcp.window_size > 1024
SYN Scans
TCP SYN Scan in a nutshell:
- Doesn’t rely on the three-way handshake (no need to finish the handshake process).
- Usually conducted with
nmap -sScommand. - Used by privileged users.
- Usually have a size less than or equal to 1024 bytes as the request is not finished and it doesn’t expect to receive data.
Open TCP port (SYN):
Closed TCP port (SYN):
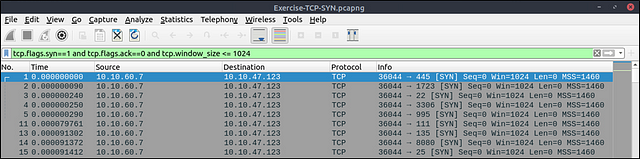
The given filter shows the TCP SYN scan patterns in a capture file.
tcp.flags.syn==1 and tcp.flags.ack==0 and tcp.window_size <= 1024
UDP Scans
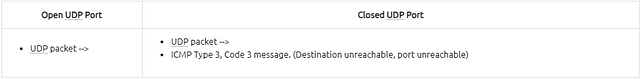
UDP Scan in a nutshell:
- Doesn’t require a handshake process
- No prompt for open ports
- ICMP error message for close ports
- Usually conducted with
nmap -sUcommand.
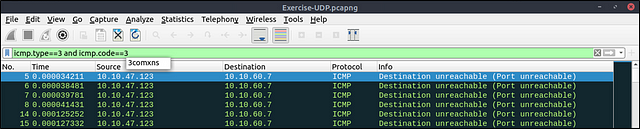
Closed (port no 69) and open (port no 68) UDP ports:
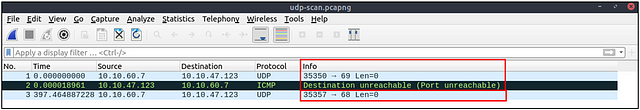
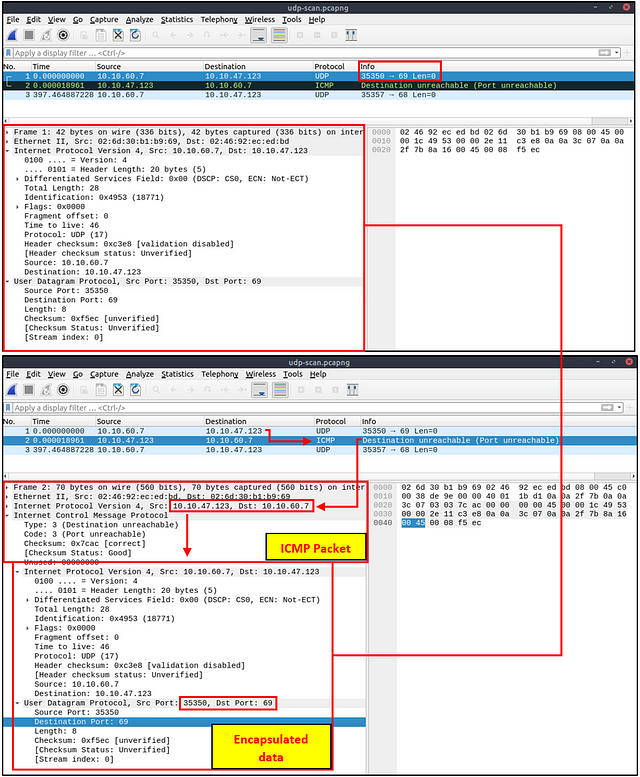
The above image shows that the closed port returns an ICMP error packet. No further information is provided about the error at first glance, so how can an analyst decide where this error message belongs? The ICMP error message uses the original request as encapsulated data to show the source/reason of the packet. Once you expand the ICMP section in the packet details pane, you will see the encapsulated data and the original request, as shown in the below image.
The given filter shows the UDP scan patterns in a capture file.
icmp.type==3 and icmp.code==3
Detecting suspicious activities in chunked files is easy and a great way to learn how to focus on the details. Now use the exercise files to put your skills into practice against a single capture file and answer the questions below!
Answer the questions below
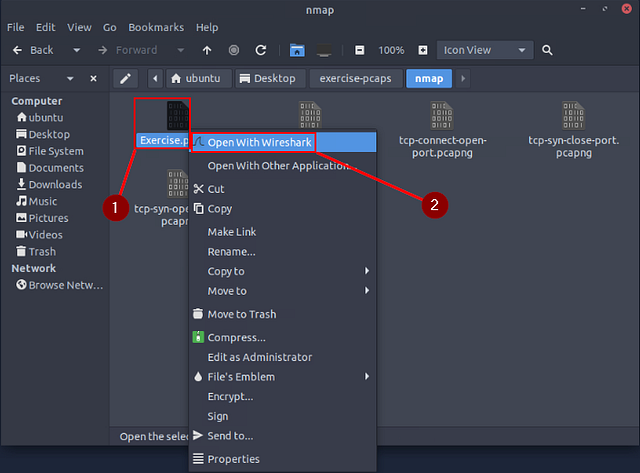
Use the “Desktop/exercise-pcaps/nmap/Exercise.pcapng” file.
Inside the exercise-pcaps folder, double-click on the nmap folder.
Inside the nmap folder you will see the Exercise.pcap file. Right-click on it, then choose Open With Wireshark from the drop-down menu.
You are now ready to answer the following questions.
What is the total number of the “TCP Connect” scans?
The command needed to find the answer is given above. But I am going to explain what exactly the command is looking for. In short this command looks for the TCP Connect Scan that results in a Closed Port. The tcp.flags.syn == 1 looks for the SYN flag being set on a TCP packet. Then the tcp.flags.ack == 0 is looking for any packet that doesn’t have the ACK flag set. Finally it is also looking for any packet that has a size greater than 1024 bytes. After we put together the command, it will be tcp.flags.syn==1 and tcp.flags.ack==0 and tcp.window_size > 1024 . Type this into the mint green filter bar, then press enter to use this filter on the pcapng.
Look at the bottom right of the Wireshark window. You are looking for the word Displayed:. The numbers to the right of Displayed, is the answer. Type the answer in the THM answer field, and then click submit.
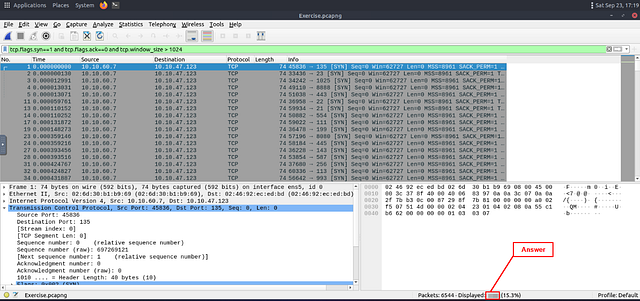
Answer: 1000
Which scan type is used to scan the TCP port 80?
Since we want to know that we are looking at port 80 via TCP. Click on the mint green filter bar, and use the filter tcp.port == 80. This will filter out and display only packets that travel over TCP to port 80. Press enter to use apply this filter.

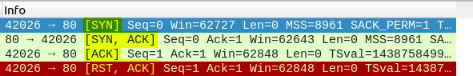
You will be left with 7 results. Looking at the first 4 results we can see that they are all part of the same stream by the connecting bracket. So next we want to move down to the Info section, to figure out what type of scan this could be.
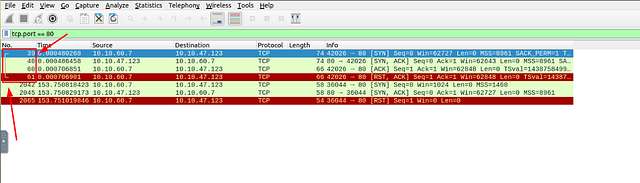
Taking a look at the different flags that were used, we see SYN, SYN ACK, ACK, RST ACK. It looks like the process of a Three-way Handshake. Knowing this, along with what we read above, we can figure out what type of scan this is. Once you figure it out, type the answer in the THM answer field, and then click submit.
Answer: tcp connect
How many “UDP close port” messages are there?
The command needed to find the answer is given above. But I am going to explain what exactly the command is looking for. With the filter we are looking at both the ICMP type and code, both of which is 3. We know this by the information given to us by THM above in the table. So the filter is icmp.type == 3 and icmp.code == 3. Once you have typed the filter into the mint green filter bar, press enter to use it.
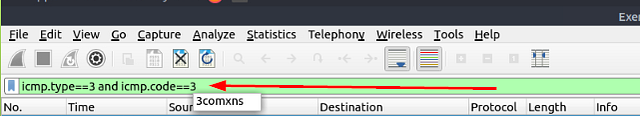
Look at the bottom right of the Wireshark window. You are looking for the word Displayed:. The numbers to the right of Displayed, is the answer. Type the answer in the THM answer field, and then click submit.

Answer: 1083
Which UDP port in the 55–70 port range is open?
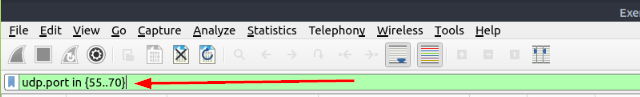
The question is looking to find out which UDP port is open amongst the port range. To be honest, I had to do some searching to figure out the correct syntax for the filter. Huge shout out to Chris Greer, and his YouTube Short that shows how to properly create this filter. Since we are looking for a UDP protocol port, we start the filter with udp.port. Then we are looking at the ports in a port range, we add the in operator. Now it’s time for the port range, to achieve this we need to use the curly brackets ({ }). We then put the port range in between the curly bracket with a double period between the numbers, 55..70. Let’s put it all together, udp.port in {55..70}. Type the filter into the mint green filter bar, then press enter to use.
As we can see from the search results, the first UDP attempts met a closed port. But upon the third try, an open port was found. Once you see the open port. Type the answer in the THM answer field, and then click submit.
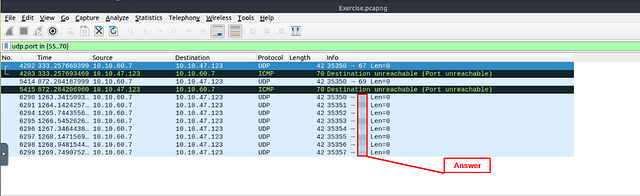
Answer: 68