Task 1 Introduction
Introduction to hands-on network monitoring and threat detection with Zeek (formerly Bro).

Zeek (formerly Bro) is an open-source and commercial network monitoring tool (traffic analyser).
The official description; “Zeek (formerly Bro) is the world’s leading platform for network security monitoring. Flexible, open-source, and powered by defenders.” “Zeek is a passive, open-source network traffic analyser. Many operators use Zeek as a network security monitor (NSM) to support suspicious or malicious activity investigations. Zeek also supports a wide range of traffic analysis tasks beyond the security domain, including performance measurement and troubleshooting.”
The room aims to provide a general network monitoring overview and work with Zeek to investigate captured traffic. This room will expect you to have basic Linux familiarity and Network fundamentals (ports, protocols and traffic data). We suggest completing the “Network Fundamentals” path before starting working in this room.
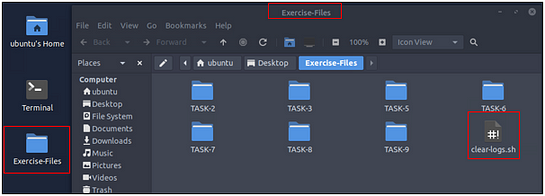
A VM is attached to this room. You don’t need SSH or RDP; the room provides a “Split View” feature. Exercise files are located in the folder on the desktop. Log cleaner script “clear-logs.sh” is available in each exercise folder.
Getting the VM Started
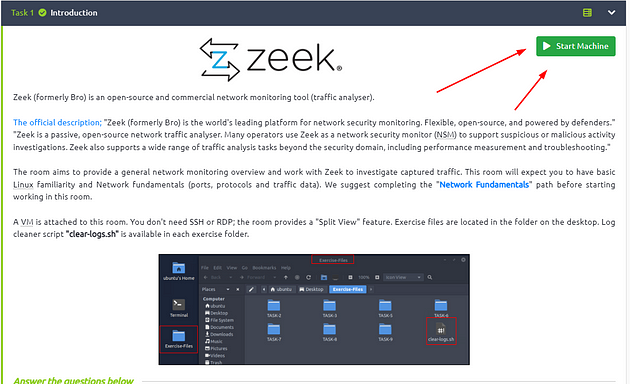
Click the green button labeled Start Machine, in the top of Task 1.
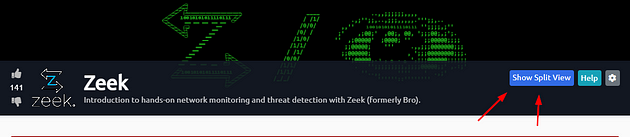
The screen should split in half, if it doesn’t go to the top of the page. You will see a blue button labeled Show Split View, click this button.
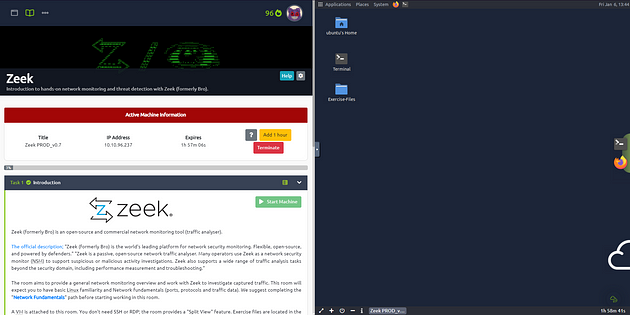
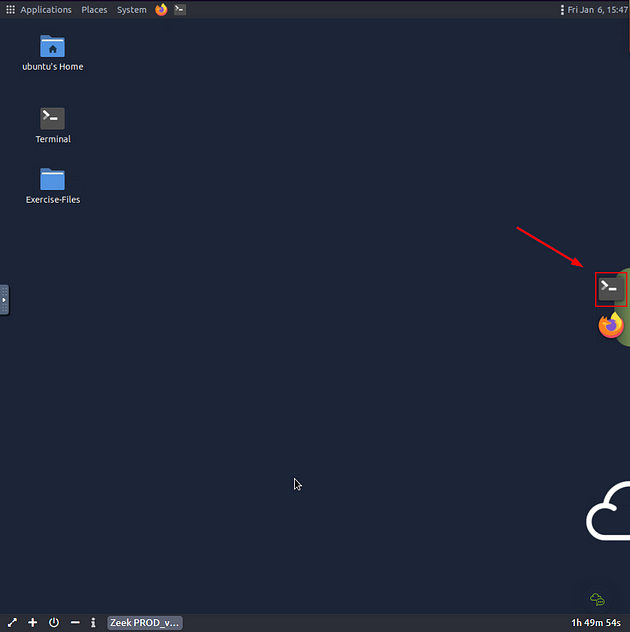
The screen should be split now, you just have to wait for the VM to load. When it is finshed loading it will look like it does below. You are ready to continue with the tasks ahead.
Task 2 Network Security Monitoring and Zeek

Introduction to Network Monitoring Approaches
Network monitoring is a set of management actions to watch/continuously overview and optionally save the network traffic for further investigation. This action aims to detect and reduce network problems, improve performance, and in some cases, increase overall productivity. It is a main part of the daily IT/SOC operations and differs from Network Security Monitoring (NSM) in its purpose.
Network Monitoring
Network monitoring is highly focused on IT assets like uptime (availability), device health and connection quality (performance), and network traffic balance and management (configuration). Monitoring and visualising the network traffic, troubleshooting, and root cause analysis are also part of the Network Monitoring process. This model is helpful for network administrators and usually doesn’t cover identifying non-asset in-depth vulnerabilities and significant security concerns like internal threats and zero-day vulnerabilities. Usually, Network Monitoring is not within the SOC scope. It is linked to the enterprise IT/Network management team.
Network Security Monitoring
Network Security Monitoring is focused on network anomalies like rogue hosts, encrypted traffic, suspicious service and port usage, and malicious/suspicious traffic patterns in an intrusion/anomaly detection and response approach. Monitoring and visualising the network traffic and investigating suspicious events is a core part of Network Security Monitoring. This model is helpful for security analysts/incident responders, security engineers and threat hunters and covers identifying threats, vulnerabilities and security issues with a set of rules, signatures and patterns. Network Security Monitoring is part of the SOC, and the actions are separated between tier 1–2–3 analyst levels.
What is ZEEK?
Zeek (formerly Bro) is an open-source and commercial passive Network Monitoring tool (traffic analysis framework) developed by Lawrence Berkeley Labs. Today, Zeek is supported by several developers, and Corelight provides an Enterprise-ready fork of Zeek. Therefore this tool is called both open source and commercial. The differences between the open-source version and the commercial version are detailed here.
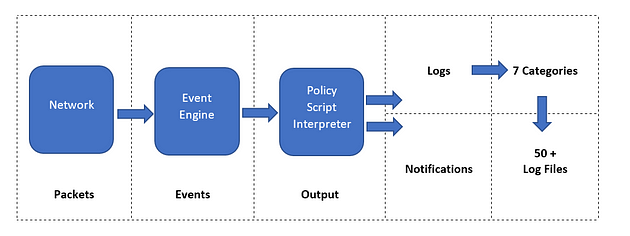
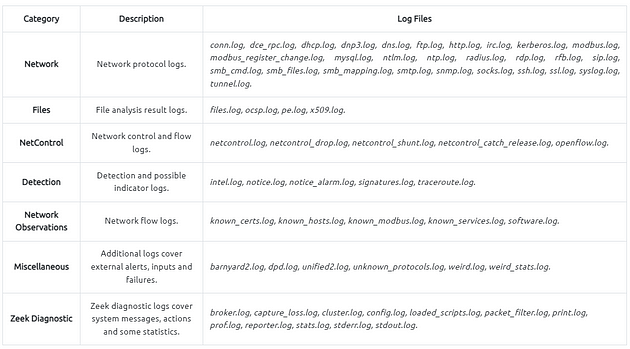
Zeek differs from known monitoring and IDS/IPS tools by providing a wide range of detailed logs ready to investigate both for forensics and data analysis actions. Currently, Zeek provides 50+ logs in 7 categories.
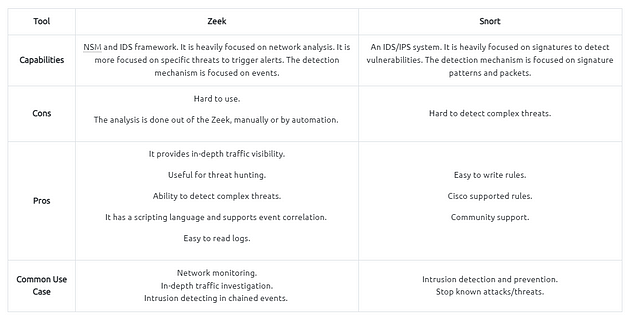
Zeek vs Snort
While both are called IDS/NIDS, it is good to know the cons and pros of each tool and use them in a specific manner. While there are some overlapping functionalities, they have different purposes for usage.
Zeek Architecture
Zeek has two primary layers; “Event Engine” and “Policy Script Interpreter”. The Event Engine layer is where the packets are processed; it is called the event core and is responsible for describing the event without focusing on event details. It is where the packages are divided into parts such as source and destination addresses, protocol identification, session analysis and file extraction. The Policy Script Interpreter layer is where the semantic analysis is conducted. It is responsible for describing the event correlations by using Zeek scripts.
Zeek Frameworks
Zeek has several frameworks to provide extended functionality in the scripting layer. These frameworks enhance Zeek’s flexibility and compatibility with other network components. Each framework focuses on the specific use case and easily runs with Zeek installation. For instance, we will be using the “Logging Framework” for all cases. Having ide on each framework’s functionality can help users quickly identify an event of interest.
Available Frameworks
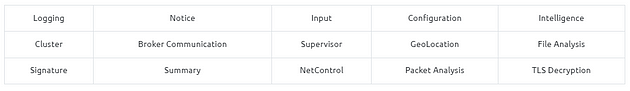
You can read more on frameworks here.
Zeek Outputs
As mentioned before, Zeek provides 50+ log files under seven different categories, which are helpful in various areas such as traffic monitoring, intrusion detection, threat hunting and web analytics. This section is not intended to discuss the logs in-depth. The logs are covered in TASK 3.
Once you run Zeek, it will automatically start investigating the traffic or the given pcap file and generate logs automatically. Once you process a pcap with Zeek, it will create the logs in the working directory. If you run the Zeek as a service, your logs will be located in the default log path. The default log path is:/opt/zeek/logs/
Working with Zeek
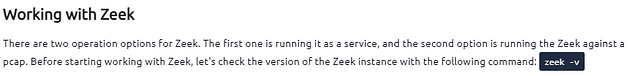
There are two operation options for Zeek. The first one is running it as a service, and the second option is running the Zeek against a pcap. Before starting working with Zeek, let’s check the version of the Zeek instance with the following command: zeek -v
Now we are sure that we have Zeek installed. Let’s start the Zeek as a service! To do this, we need to use the “ZeekControl” module, as shown below. The “ZeekControl” module requires superuser permissions to use. You can elevate the session privileges and switch to the superuser account to examine the generated log files with the following command: sudo su
Here we can manage the Zeek service and view the status of the service. Primary management of the Zeek service is done with three commands; “status”, “start”, and “stop”.
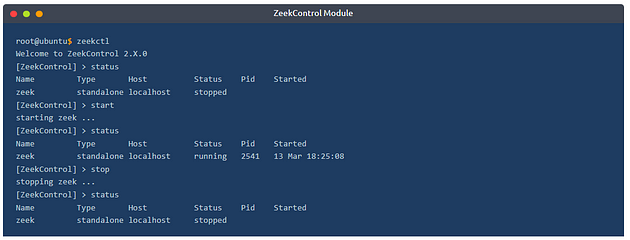
You can also use the “ZeekControl” mode with the following commands as well;
zeekctl statuszeekctl startzeekctl stop
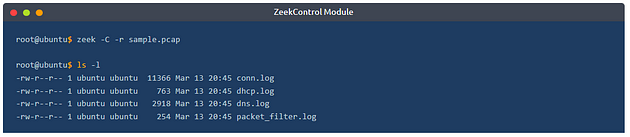
The only way to listen to the live network traffic is using Zeek as a service. Apart from using the Zeek as a network monitoring tool, we can also use it as a packet investigator. To do so, we need to process the pcap files with Zeek, as shown below. Once you process a pcap file, Zeek automatically creates log files according to the traffic.
In pcap processing mode, logs are saved in the working directory. You can view the generated logs using the ls -l command.
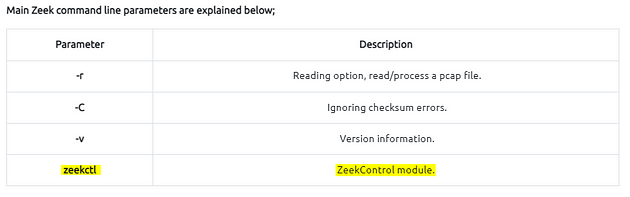
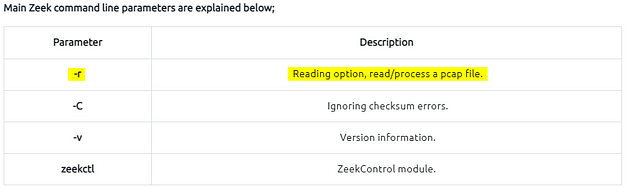
Main Zeek command line parameters are explained below;
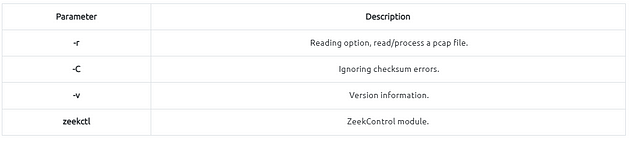
Investigating the generated logs will require command-line tools (cat, cut, grep sort, and uniq) and additional tools (zeek-cut). We will cover them in the following tasks.
Answer the questions below
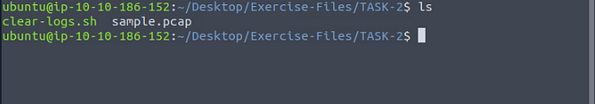
Each exercise has a folder. Ensure you are in the right directory to find the pcap file and accompanying files. Desktop/Exercise-Files/TASK-2
On the VM, you will see a terminal icon in the middle of the VM screen on the right. Click on it.
A terminal window will pop-up, time to move to the TASK-2 directory. To do this we will use the cd command, which stands for change directory. We will using this command in combination with Tab completion. With Tab complete, you only have to press Tab after starting to type, and if it only has one entry that matches, it will auto complete it. So let’s type out the command cd Desktop/Exercise-Files/TASK-2, then press enter to run the command.
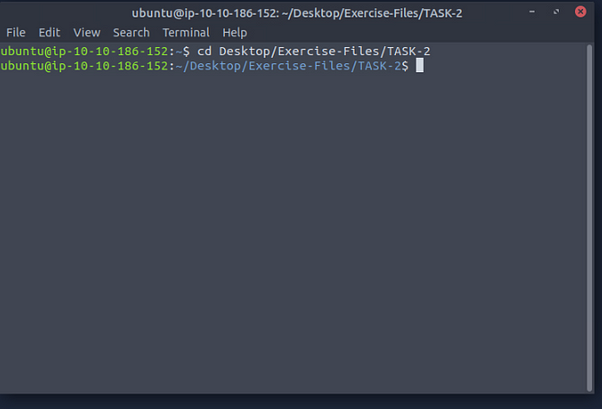
You are now in the proper directory, use the command ls to list the contents of the directory. We are now ready to move on to the next question.
What is the installed Zeek instance version number?
If we look up above in the Working With Zeek section, we can find the correct parameter to run to get the version number of Zeek. In this case it is zeek -v.
Heading back to the terminal, we use the command from above, zeek -v, and press enter. It will output the current version of Zeek, and thus the answer to the question. Type the answer into the TryHackMe answer field, then click submit.

Answer: 4.2.1
What is the version of the ZeekControl module?
From the table at the bottom of this task, we learned that we can use the command zeekctl, to start in the ZeekControl module.
Heading back to the terminal, we use the command from above, zeekctl, and press enter. It will output the current version of ZeekControl, and thus the answer to the question. Type the answer into the TryHackMe answer field, then click submit.
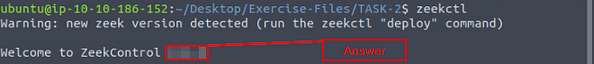
Answer: 2.4.0
Investigate the “sample.pcap” file. What is the number of generated alert files?
Again we look at the table at the bottom of this task to get ther proper parameters. In our case we want to use the -r, this will process a pcap file and give use the log files.
Heading back to the terminal, we use the command zeek -r sample.pcap, TryHackMe gave us the name of the file, so that is how we know name of the pcap file we want to parse.

After Zeek is done running we need to count the number of logs generated. To do this we can use the command ls, to list out the contents of the directory. Once the output of the dirctory is listed in the output, we just count everything that ends with .log. After counting them we will have our answer to the question. Type the answer into the TryHackMe answer field, then click submit.

Answer: 8
Task 3 Zeek Logs
Zeek Logs
Zeek generates log files according to the traffic data. You will have logs for every connection in the wire, including the application level protocols and fields. Zeek is capable of identifying 50+ logs and categorising them into seven categories. Zeek logs are well structured and tab-separated ASCII files, so reading and processing them is easy but requires effort. You should be familiar with networking and protocols to correlate the logs in an investigation, know where to focus, and find a specific piece of evidence.
Each log output consists of multiple fields, and each field holds a different part of the traffic data. Correlation is done through a unique value called “UID”. The “UID” represents the unique identifier assigned to each session.
Zeek logs in a nutshell;
Please refer to Zeek’s official documentation and Corelight log cheat sheet for more information. Although there are multiple log files, some log files are updated daily, and some are updated in each session. Some of the most commonly used logs are explained in the given table.

This is too much protocol and log information! Yes, it is true; a difficulty of working with Zeek is having the required network knowledge and investigation mindset. Don’t worry; you can have both of these and even more knowledge by working through TryHackMe paths. Just keep the streak!
Brief log usage primer table;
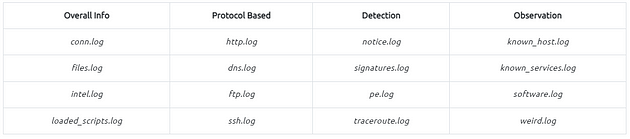
You can categorise the logs before starting an investigation. Thus, finding the evidence/anomaly you are looking for will be easier. The given table is a brief example of using multiple log files. You can create your working model or customise the given one. Make sure you read each log description and understand the purpose to know what to expect from the corresponding log file. Note that these are not the only ones to focus on. Investigated logs are highly associated with the investigation case type and hypothesis, so do not just rely only on the logs given in the example table!
The table shows us how to use multiple logs to identify anomalies and run an investigation by correlating across the available logs.
- Overall Info: The aim is to review the overall connections, shared files, loaded scripts and indicators at once. This is the first step of the investigation.
- Protocol Based: Once you review the overall traffic and find suspicious indicators or want to conduct a more in-depth investigation, you focus on a specific protocol.
- Detection: Use the prebuild or custom scripts and signature outcomes to support your findings by having additional indicators or linked actions.
- Observation: The summary of the hosts, services, software, and unexpected activity statistics will help you discover possible missing points and conclude the investigation.
Remember, we mention the pros and cons of the Zeek logs at the beginning of this task. Now let’s demonstrate the log viewing and identify the differences between them.
Recall 1: Zeek logs are well structured and tab-separated ASCII files, so reading and processing them is easy but requires effort.
Recall 2: Investigating the generated logs will require command-line tools (cat, cut, grep sort, and uniq) and additional tools (zeek-cut).
Opening a Zeek log with a text editor and built-in commands;
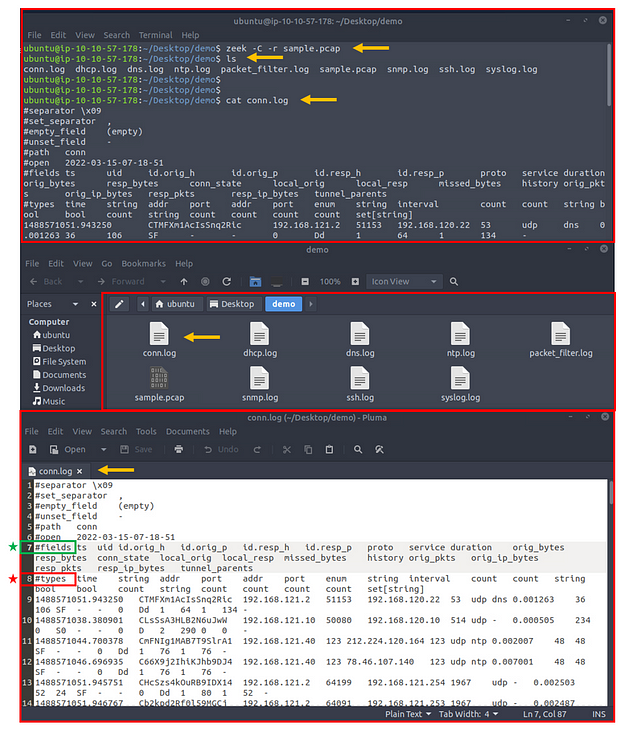
The above image shows that reading the logs with tools is not enough to spot an anomaly quickly. Logs provide a vast amount of data to investigate and correlate. You will need to have technical knowledge and event correlation ability to carry out an investigation. It is possible to use external visualisation and correlation tools such as ELK and Splunk. We will focus on using and processing the logs with a hands-on approach in this room.
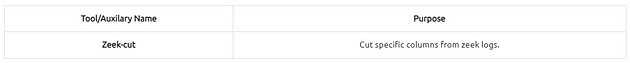
In addition to Linux command-line tools, one auxiliary program called zeek-cut reduces the effort of extracting specific columns from log files. Each log file provides “field names” in the beginning. This information will help you while using zeek-cut. Make sure that you use the “fields” and not the “types”.
Let’s see the “zeek-cut” in action. Let’s extract the uid, protocol, source and destination hosts, and source and destination ports from the conn.log. We will first read the logs with the cat command and then extract the event of interest fields with zeek-cut auxiliary to compare the difference.
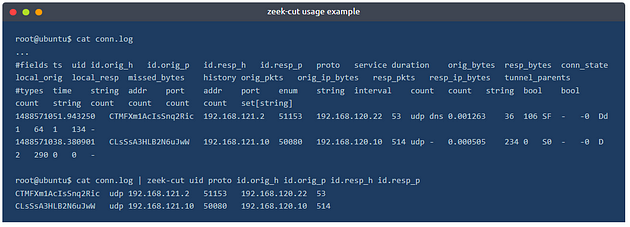
As shown in the above output, the “zeek-cut” auxiliary provides massive help to extract specific fields with minimal effort. Now take time to read log formats, practice the log reading/extracting operations and answer the questions.
Answer the questions below
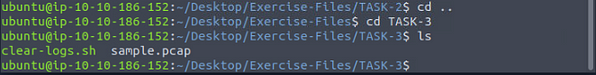
Each exercise has a folder. Ensure you are in the right directory to find the pcap file and accompanying files. Desktop/Exercise-Files/TASK-3
You should still be in the TASK-2 directory, so we need to back up then move forward. To do this we use the command cd .., which will back it up one directory. Then using the command cd TASK-3, we move forward into the TASK-3 directory. Finally use the ls command to list the contents.
Investigate the sample.pcap file. Investigate the dhcp.log file. What is the available hostname?
As we learned from the previous task to investigate the sample.pcap file, we need to use the command zeek -r sample.pcap, then press enter to run Zeek.
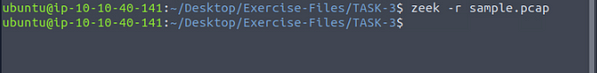
Using cat dhcp.log, we will display the log file on the terminal. The reasoning behind this is to see what the fields names are. As we can see the one we want to look at is host_name.
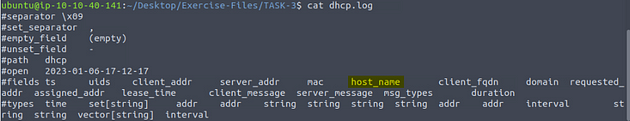
If we look to the table in the above reading, we learn about a command called zeek-cut, we can use this command to cut different parts of the log file and output them to the terminal.
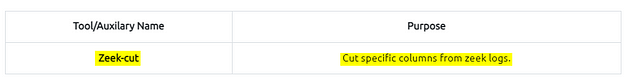
Using the zeek-cut command, we then will display the log file to the terminal and pipe that through Zeek-cut. The full command will be cat dhcp.log | zeek-cut host_name, press enter to run the command. You will have the same name displayed twice, this is the hostname, and thus the answer to the question. Type the answer into the TryHackMe answer field, then click submit.

Answer: Microknoppix
Investigate the dns.log file. What is the number of unique DNS queries?
Using cat dns.log, we will display the log file on the terminal. The reasoning behind this is to see what the fields names are. As we can see the one we want to look at is query.
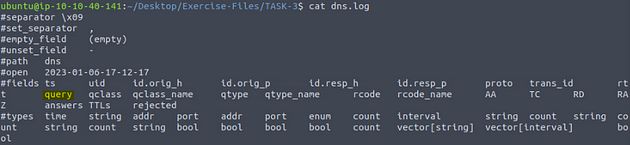
Now that we know the field name we need to use the command cat dns.log | zeek-cut query | uniq, we will pipe our zeek-cut response through the uniq command to get rid of multiples of the same response. So after running the command, count the number of responses output in the terminal, this is the answer to the question. Type the answer into the TryHackMe answer field, then click submit.

Answer: 2
Investigate the conn.log file. What is the longest connection duration?
Using cat conn.log, we will display the log file on the terminal. The reasoning behind this is to see what the fields names are. As we can see the one we want to look at is duration.
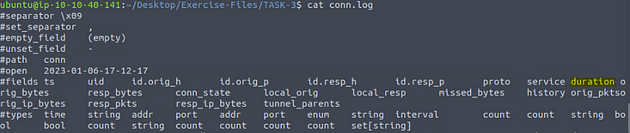
So we will need to add some extra commands to get what we are looking for. First one is sort -n, which will sort the ouput and the -n will make that sorting numerical. Next is tail -1, this will normailly display the bottom 10 results, but since we use the -1, it will only show the final result. So the full command is cat conn.log | zeek-cut duration | sort -n | tail -1, after you have all this typed out, the result should be the longest duration, and thus the answer to the question. Type the answer into the TryHackMe answer field, then click submit.

Answer: 332.319364
| You have finished these tasks, and can now move onto Task 4 CLI Kung-Fu Recall: Processing Zeek Logs, Task 5 Zeek Signatures, and Task 6 Zeek Scripts | Fundamentals. |